unbalanced cell count and unbalanced read count across samples in pseudobulk differential expression analysis using scRNA-seq data
1
0
Entering edit mode
Ismail • 0
@c205bf4c
Last seen 18 months ago
Germany

Dear DESeq2 experts,

I hope my message finds you fine. I am facing a problem in carrying out differential gene expression analysis using DESeq2 in a scRNA-seq dataset. I have clustered cells into distinct clusters and created pseudobulk counts by summing gene read counts of cells in a given cluster in each sample and would like to carry out differential expression analysis using these pseudobulks.

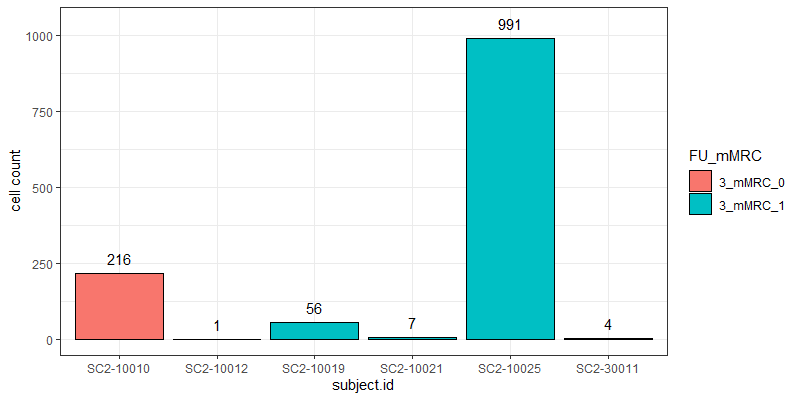
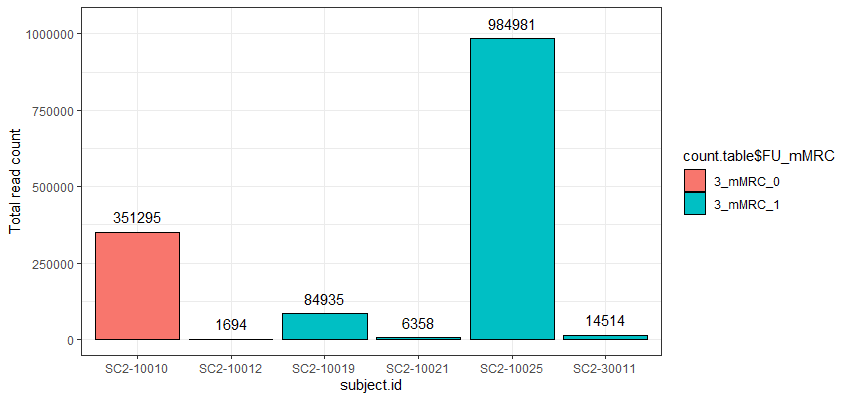
The problem I am facing now is that the cell counts as well as the total read counts (after count aggregation) across the different samples greatly vary and are very much unbalanced as you can see in the attached graphs.

Now, if I run DEseq2, I get no significantly differentially expressed genes between the two comparsion groups I am interested in.

Is there a solution to this problem? Can one still use DESeq2 to analyze differential expression in such a scenario?

*The graphs here show the number of cells and the total number of reads across samples in one particular cell cluster. The red and green colors indicate the two different groups I would like to compare.

 number of cells across the different samples in one specific cell cluster

Total read count after count aggregation in one specific cell cluster

scRNAseq DifferentialExpression DESeq2 • 1.8k views
ADD COMMENT
1
Entering edit mode
@steve-lianoglou-2771
Last seen 14 months ago
United States

Do you only have 2 "red" samples, and is the second red cluster SC2-10012 consisting of one cell?

I've found that using pseudobulked data across samples & clusters can produce wonky results when you have pseudobulked-clusters that consist of very few cells. In the past, I have removed a pseudobulked cluster from a sample prior to performing differential expression analysis if it came from fewer than (say) 50 cells.

We can argue how one might choose the number of cells a pseudobulked cluster should have in order to use it for downstream analysis, but when it consists of just one cell, I think we can all agree that it's not replicating the properties we hope to see in a pseudobulked sample. For me, your clusters of seven and four cells in the green group would also be suspicious.

Unless you have vastly different number of cells from each of your samples, the distribution of cells in this cluster across your samples within the groups seems quite heterogeneous, and if I were analyzing this dataset I might try to understand what's up with that. It might prompt me to focus an analysis using a different resolution for my clusters, or do a bit more exploratory data analysis to see if I need to account for some batch effects upstream of merging my data together by using something like fastMNN, for instance.

ADD COMMENT
0
Entering edit mode

Thank you very much for your kind opinion. I think setting a threshold for the minimum cluster size to include in the analysis is a good way to deal with this problem :)

ADD REPLY

Login before adding your answer.

Traffic: 412 users visited in the last hour
Help About
FAQ
Access RSS
API
Stats

Use of this site constitutes acceptance of our User Agreement and Privacy Policy.

Powered by the version 2.3.6