Hello.
I am trying to run lfcShrink() on one of the contrasts created with the results() function but that contrast does not apprear in the resultsNames(dds), so the lfcShrink() gives me an error.
Thanks for any help in advance!
dds <- DESeqDataSetFromMatrix(
  countData = countdata,
  colData = coldata,
  design = ~ replicado + condition)
dds
saveRDS(dds, "dds")

keep <- rowSums(counts(dds)) >= 10
dds <- dds[keep,]

dds$condition <- factor(dds$condition, levels = c("UNT","E2","GW","E2GW"))
dds$condition

dds <- DESeq(dds)

SaveUPandDown = function(a,b){
  comp <- results(dds, contrast = c("condition", a, b), alpha=0.05)
  #write.csv(comp, paste0(a,"vs",b,".csv"))
  print(summary(comp))
  comp_sinNAs = comp[complete.cases(comp[,"padj"]),]

  comp_up = comp_sinNAs[comp_sinNAs$log2FoldChange>0 & comp_sinNAs$padj<0.05,]
  comp_up$ENSID = rownames(comp_up)
  comp_up = left_join(data.frame(comp_up), IDs_table, by="ENSID")
  comp_up = comp_up[, c("ENSID","SYMBOL","baseMean","log2FoldChange","lfcSE","stat","pvalue","padj")]
  comp_up = arrange(comp_up, desc(log2FoldChange))
  #write.csv(comp_up, paste0(a,"vs",b,"_up.csv"))

  comp_down = comp_sinNAs[comp_sinNAs$log2FoldChange<0 & comp_sinNAs$padj<0.05,]
  comp_down$ENSID = rownames(comp_down)
  comp_down = left_join(data.frame(comp_down), IDs_table, by="ENSID")
  comp_down = comp_down[, c("ENSID","SYMBOL","baseMean","log2FoldChange","lfcSE","stat","pvalue","padj")]
  comp_down = arrange(comp_down, log2FoldChange)
  #write.csv(comp_down, paste0(a,"vs",b,"_down.csv"))

  return(list("ALL"=comp , "UP"= comp_up, "DOWN"=comp_down))

}

E2vsUNT = SaveUPandDown("E2", "UNT")
GWvsUNT = SaveUPandDown("GW", "UNT")
E2GWvsUNT = SaveUPandDown("E2GW", "UNT")
E2GWvsE2 = SaveUPandDown("E2GW", "E2")
E2GWvsGW = SaveUPandDown("E2GW", "GW")

resultsNames(dds)
# [1] "Intercept"             "replicado_2_vs_1"      "condition_E2_vs_UNT"   "condition_GW_vs_UNT"   "condition_E2GW_vs_UNT"

E2GWvsE2_LFC <- lfcShrink(dds, coef="condition_E2GW_vs_E2", type="apeglm")
#Error in lfcShrink(dds, coef = "condition_E2GW_vs_E2", type = "apeglm") :
# coef %in% resultsNamesDDS is not TRUE


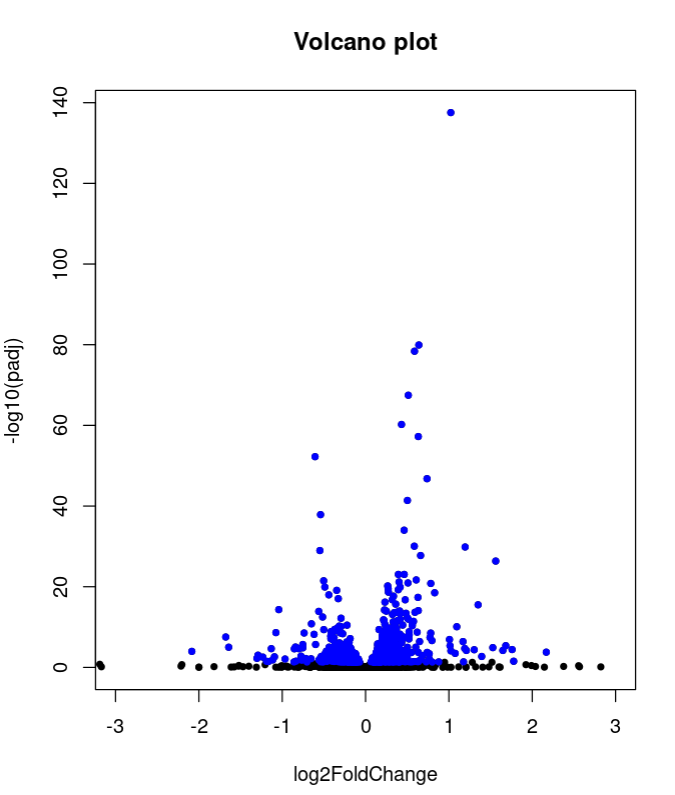
with(E2GWvsE2$ALL, plot(log2FoldChange, -log10(padj), pch=20, main="Volcano plot", xlim=c(-3,3)))
with(subset(E2GWvsE2$ALL, padj<.05 ), points(log2FoldChange, -log10(padj), pch=20, col="blue"))
Also, the shape of volcano plot of of E2GWvsE2 is a bit strange, with some genes with really large values of logFC. That is why I wanted to try the plot with the shrunken values, to see if the plot improves.
sessionInfo( )
R version 4.2.1 (2022-06-23)
Platform: x86_64-pc-linux-gnu (64-bit)
Running under: Ubuntu 22.04.1 LTS

Matrix products: default
BLAS:   /usr/lib/x86_64-linux-gnu/blas/libblas.so.3.10.0
LAPACK: /usr/lib/x86_64-linux-gnu/lapack/liblapack.so.3.10.0

locale:
 [1] LC_CTYPE=en_US.UTF-8       LC_NUMERIC=C               LC_TIME=es_AR.UTF-8        LC_COLLATE=en_US.UTF-8     LC_MONETARY=es_AR.UTF-8
 [6] LC_MESSAGES=en_US.UTF-8    LC_PAPER=es_AR.UTF-8       LC_NAME=C                  LC_ADDRESS=C               LC_TELEPHONE=C
[11] LC_MEASUREMENT=es_AR.UTF-8 LC_IDENTIFICATION=C

attached base packages:
[1] stats4    stats     graphics  grDevices datasets  utils     methods   base

other attached packages:
 [1] venn_1.11                   forcats_0.5.2               stringr_1.4.1               dplyr_1.0.9                 purrr_0.3.4
 [6] readr_2.1.2                 tidyr_1.2.0                 tibble_3.1.8                ggplot2_3.3.6               tidyverse_1.3.2
[11] DESeq2_1.36.0               SummarizedExperiment_1.26.1 Biobase_2.56.0              MatrixGenerics_1.8.1        matrixStats_0.62.0
[16] GenomicRanges_1.48.0        GenomeInfoDb_1.32.3         IRanges_2.30.1              S4Vectors_0.34.0            BiocGenerics_0.42.0

loaded via a namespace (and not attached):
 [1] bitops_1.0-7           fs_1.5.2               lubridate_1.8.0        bit64_4.0.5            RColorBrewer_1.1-3     httr_1.4.4
 [7] numDeriv_2016.8-1.1    tools_4.2.1            backports_1.4.1        utf8_1.2.2             R6_2.5.1               DBI_1.1.3
[13] colorspace_2.0-3       apeglm_1.18.0          withr_2.5.0            tidyselect_1.1.2       bit_4.0.4              compiler_4.2.1
[19] cli_3.3.0              rvest_1.0.3            xml2_1.3.3             DelayedArray_0.22.0    labeling_0.4.2         scales_1.2.1
[25] mvtnorm_1.1-3          genefilter_1.78.0      digest_0.6.29          XVector_0.36.0         pkgconfig_2.0.3        bbmle_1.0.25
[31] dbplyr_2.2.1           fastmap_1.1.0          rlang_1.0.4            readxl_1.4.1           rstudioapi_0.14        RSQLite_2.2.16
[37] farver_2.1.1           generics_0.1.3         jsonlite_1.8.0         BiocParallel_1.30.3    googlesheets4_1.0.1    RCurl_1.98-1.8
[43] magrittr_2.0.3         GenomeInfoDbData_1.2.8 Matrix_1.4-1           Rcpp_1.0.9             munsell_0.5.0          fansi_1.0.3
[49] lifecycle_1.0.1        stringi_1.7.8          MASS_7.3-58            zlibbioc_1.42.0        plyr_1.8.7             grid_4.2.1
[55] blob_1.2.3             parallel_4.2.1         bdsmatrix_1.3-6        crayon_1.5.1           lattice_0.20-45        Biostrings_2.64.1
[61] haven_2.5.1            splines_4.2.1          annotate_1.74.0        hms_1.1.2              KEGGREST_1.36.3        locfit_1.5-9.6
[67] pillar_1.8.1           geneplotter_1.74.0     codetools_0.2-18       admisc_0.29            reprex_2.0.2           XML_3.99-0.10
[73] glue_1.6.2             renv_0.15.5            modelr_0.1.9           png_0.1-7              vctrs_0.4.1            tzdb_0.3.0
[79] cellranger_1.1.0       gtable_0.3.0           assertthat_0.2.1       emdbook_1.3.12         cachem_1.0.6           xtable_1.8-4
[85] broom_1.0.0            coda_0.19-4            survival_3.4-0         googledrive_2.0.0      gargle_1.2.0           AnnotationDbi_1.58.0
[91] memoise_2.0.1          ellipsis_0.3.2


Oh, ok. I did not know that the resultsNames is just showing the ones against the reference level. But then, why do I get this error message later?
apeglm does not use contrasts, hence the coefficients must be available in the resultsNames. If that is not the case you have to relevel and rerun the Wald test. This has all been asked before, please read the manual and google your error/question before posting. DESeq2 is so heavily used, 99.o% of things have been asked before: https://www.biostars.org/p/448959/