
I have results of differential expression analysis from 17 datasets, using the LIMMA package. For each dataset, the genes are in a data frame (called deg), along with the log fold change and the p-value. I took those data frames and stored them in a list called totalDEG , I followed this guide http://www.bioconductor.org/packages/release/bioc/vignettes/MetaVolcanoR/inst/doc/MetaVolcano.html
Note - the data frames contain all genes, including the unperturbed genes. I will specify that I want only the significant ones in the votecount_mv function.
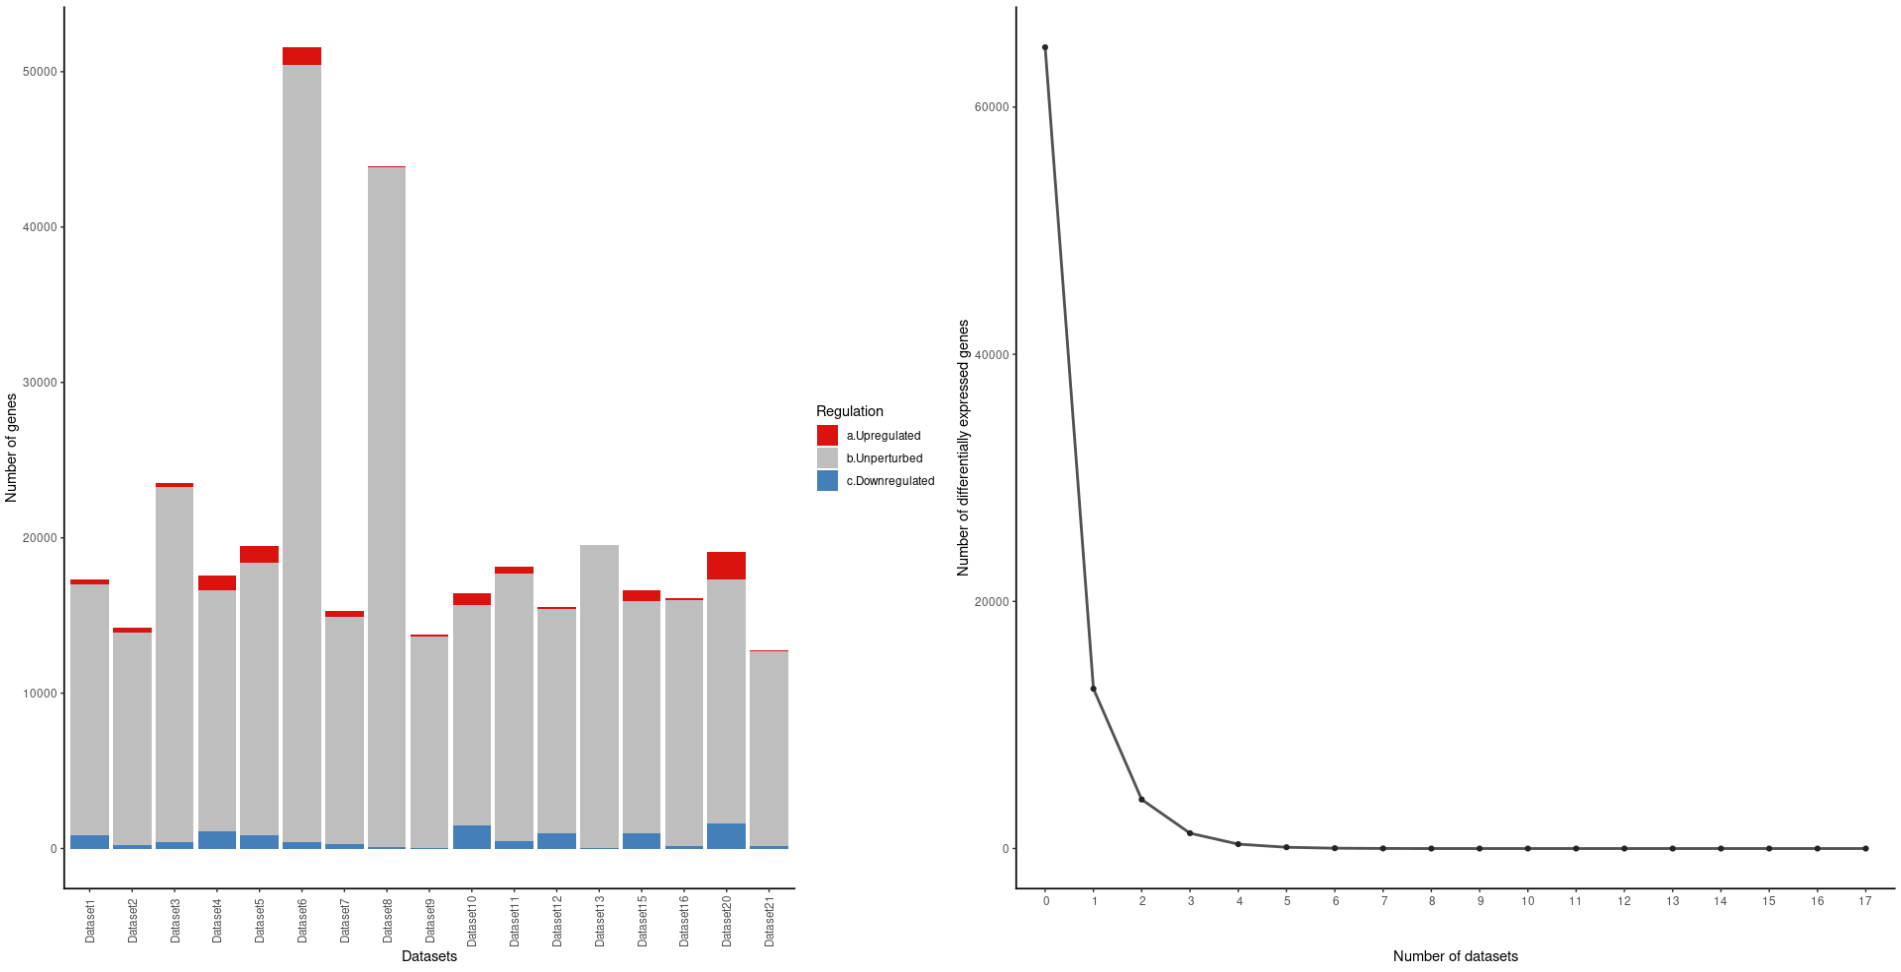
The plot is showing much more genes than there really are for some datasets. For example, it appears in the plot that Dataset6 has more than 50,000 genes, while in fact, it only has about 17,000. The same for Dataset8. Why is this happening?
And what does the right plot mean? does it show the number of differentially expressed genes that are shared along all datasets? cause my data has no genes like that.
This is the plot:
My code:
totalDEG = list(Dataset1 = deg1, Dataset2 = deg2,
                Dataset3 = deg3, Dataset4 = deg4, Dataset5 = deg5, Dataset6 = deg6,
                Dataset7 = deg7, Dataset8 = deg8 ,Dataset9 = deg9, Dataset10 = deg10,
                Dataset11 = deg11, Dataset12 = deg12, Dataset13 = deg13 , Dataset15 = deg15,
                Dataset16 = deg16, Dataset20 = deg20, Dataset21 = deg21)

totalDEG = map(totalDEG, ~ .x %>% rownames_to_column("symbol") %>% `row.names<-`(.$symbol))

meta_degs_vote <- votecount_mv(diffexp=totalDEG,
                               pcriteria='P.Value',
                               foldchangecol='logFC',
                               genenamecol='symbol',
                               geneidcol=NULL,
                               pvalue = 0.05,
                               foldchange= 0.25,
                               metathr=0.01,
                               collaps=FALSE,
                               jobname="MetaVolcano",
                               outputfolder=".",
                               draw='HTML')

head(meta_degs_vote@metaresult, 3)
meta_degs_vote@degfreq
And this is a small example of a deg data frame (I have 17 like those):
structure(list(logFC = c(-6.9789425276725, -6.80564834512398,
-5.6476014320244, -6.26235013729251, -5.28269672881498, -3.09147686903668,
-4.96792335935695, -4.19915236394742, -4.83218090923083, -3.98281311064966,
-5.67532487307823, -5.61153529083818, -3.63779239727337, -5.51132458075007,
-5.84723411702433, -3.81087466017047, -6.63518445918401, -3.12684504261733,
-3.67427178247997, -3.55494509554008, -2.93288926187307, -3.34600996743472,
-6.95421793602619, -4.54818507041332, -4.40148611002215), CI.L = c(-8.67994440382904,
-8.75329890267049, -7.33972836815489, -8.10720823542097, -6.87728491837549,
-4.05774266553713, -6.52757600952993, -5.58307963784586, -6.45170192050377,
-5.39488819005967, -7.63936737535009, -7.58821634428815, -4.95285575867368,
-7.54470153062114, -7.95005561275759, -5.18806492548832, -9.11781751841251,
-4.32080214140813, -5.12196476973559, -4.98320918777515, -4.11606326830917,
-4.68673311153421, -9.78640386618229, -6.36301071764781, -6.20444870302627
), CI.R = c(-5.27794065151596, -4.85799778757747, -3.95547449589392,
-4.41749203916404, -3.68810853925447, -2.12521107253623, -3.40827070918396,
-2.81522509004899, -3.21265989795789, -2.57073803123965, -3.71128237080637,
-3.63485423738822, -2.32272903587306, -3.47794763087899, -3.74441262129107,
-2.43368439485263, -4.1525513999555, -1.93288794382653, -2.22657879522435,
-2.12668100330501, -1.74971525543697, -2.00528682333523, -4.1220320058701,
-2.73335942317883, -2.59852351701803), AveExpr = c(2.84380439452138,
-0.641350163188155, 1.9374612692823, -0.235638199101607, -0.435518029701078,
3.48510080561988, 1.87095233967784, 1.01628061150791, 1.22174650978923,
2.72177717639537, -1.20309940325757, -0.857551814218222, 2.20260076015391,
4.80478044066334, -1.13513003361954, 0.123295030736262, -0.675210875658111,
3.87956282628011, 2.64674998200021, 2.87011242677628, 5.51349257254121,
0.73720258641836, 2.15656931364667, -0.880676268215307, 2.38219307498489
), t = c(-8.67971178415031, -7.39228905582827, -7.06076205121055,
-7.18116415109683, -7.00854088575108, -6.76846004661448, -6.73856582234944,
-6.41902164094181, -6.31214655178395, -5.96695296657183, -6.11308339182853,
-6.00572682477871, -5.85209958519877, -5.73401160854389, -5.88258959067589,
-5.85397948220358, -5.65406688510248, -5.54036162493977, -5.36927047559566,
-5.26556350546633, -5.2440584137816, -5.2796921349758, -5.19453899631105,
-5.30180432734165, -5.16455723198513), P.Value = c(1.55229424251649e-07,
1.30133609714356e-06, 2.33015419714361e-06, 1.88260870380903e-06,
2.55754415226669e-06, 3.94282455388895e-06, 4.16345462038873e-06,
7.50810099243057e-06, 9.17340525927766e-06, 1.77065831075769e-05,
1.33775331440198e-05, 1.64325937561506e-05, 2.2115888159301e-05,
2.7847395364839e-05, 2.08446126717148e-05, 2.20352317313369e-05,
3.25827813373579e-05, 4.07954068339292e-05, 5.73909145200287e-05,
7.07062567807361e-05, 7.38445843217097e-05, 6.87194358047315e-05,
8.16281452619761e-05, 6.57245741306385e-05, 8.67463223172338e-05
), adj.P.Val = c(0.00241102341747661, 0.00794475515460126, 0.00794475515460126,
0.00794475515460126, 0.00794475515460126, 0.00923811102341111,
0.00923811102341111, 0.014576978076804, 0.0158312589430112, 0.0229002649926842,
0.0207779844792916, 0.0229002649926842, 0.0229002649926842, 0.0270328590504175,
0.0229002649926842, 0.0229002649926842, 0.0297691623371673, 0.0352019032746993,
0.0469155623328993, 0.0498675688558607, 0.0498675688558607, 0.0498675688558607,
0.0499016251196769, 0.0498675688558607, 0.0499016251196769),
    B = c(7.20297424220909, 5.12185903325429, 4.85086822927105,
    4.82778189573735, 4.47878578846026, 4.45015062142229, 4.32665141548369,
    3.68905526549073, 3.58105745979752, 3.07644941699046, 3.02010053423525,
    2.91419323987163, 2.83925429337962, 2.70647282644387, 2.69778050078078,
    2.64780216667016, 2.39793196132607, 2.34766742399694, 2.01017932857179,
    1.82776636178526, 1.80163027812608, 1.72843647510305, 1.69294586705913,
    1.66964379660484, 1.63598134270543)), row.names = c("PLIN4",
"LEP", "PLIN1", "SAA1", "RBP4", "SEMA3G", "GPD1", "FMO3", "STMN2",
"COL8A1", "SAA2", "TUSC5", "PCSK5", "JCHAIN", "PCK1", "AQP7",
"EPYC", "AOC3", "FNDC1", "LYVE1", "FHL1", "AKR1C1", "COMP", "ADAMTS18",
"G0S2"), class = "data.frame")