
Hi, This is related to the DESEQ2 Normalization. First I would describe my experiment design, I have two groups, GroupA and GroupB. Group A has 39 replicates (Biological), and Group B Has 77 replicates. The samples are human blood samples, collected and processed randomly for both groups.
RNA-Sequencing was carried out in the 3 batches, However, I have made sure that the samples from both groups should be included in each batch, therefore, I can use the deseq2 design during analysis.
I have run DESEQ2 and run differential expression analysis. I have found around 6700 genes are differentially expressed (padj < 0.05). Around 80 % of genes are downregulated. That was surprising to me. To explore possible reasons I started looking for the normalization factor calculated by the DESEQ2 and when I made a box-plot of the calculated normalization factors for both groups, the normalization factor for Group B (treatment) was significantly different than Group A. I have run the t.test and Wilcox.test and the pValue is 0.00025. I am attaching an image of the box plot for purpose of the illustrations 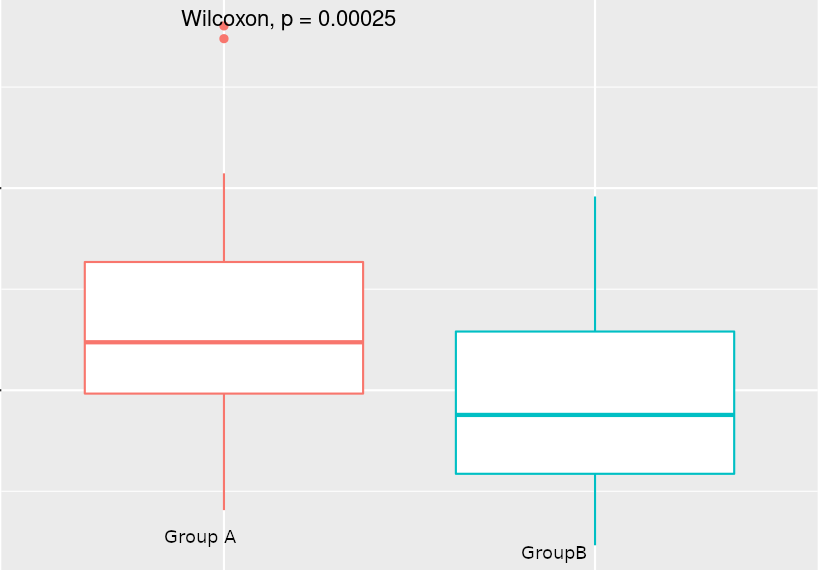
Please can you suggest that my analysis is alright or something is wrong?
Thanking you.
dds <- DESeqDataSetFromMatrix(countData = rsem.gene.count.134,colData = design.m,design = ~Batch+class)

dds <- estimateSizeFactors(dds)

factor <- data.frame(factor = dds$sizeFactor, class = dds$class)

library(ggplot2)

p <- ggplot(factor,aes(x = class, y = factor, color = class)) + geom_boxplot()

p + stat_compare_means(method = "wilcox.test")


# include your problematic code here with any corresponding output
# please also include the results of running the following in an R session

sessionInfo( )

Thank you for suggesting possible confounding factors, I have checked for the sample's sequencing depth and yes there is one batch where sequencing depth is higher than another batch, say ( 50 million versus 80 million), and in this batch number of the samples of GroupB are higher than Group A (3:1). I have tried independent filtering but getting the same result. However, I am including the batch as the covariate in the model matrix, so It should not be a factor of worry I think. Thanks for clearing the suggestion.