
Hey there, first of all, I am quite the bioinformatics and R noob, so please forgive me for my I want to analyze the differential host gene expression during virus infection. I have RNAseq data of the following samples, each with three biological replicates: Mock, 3 hours post-infection (hpi), 6hpi and 9hpi, so 12 data sets in total. I was using this website (https://ucdavis-bioinformatics-training.github.io/2018-June-RNA-Seq-Workshop/thursday/DE.html) protocol to apply limma-voom to my data in the following way:
count_file <- file.choose() #This is my csv file with all my data in one excel sheet
counts <- read.csv(count_file, row.names = 1)
d0 <- DGEList(counts)
d1 <- calcNormFactors(d0)

#Filter low-expressed genes
cutoff <- 1
drop <- which(apply(cpm(d1), 1, max) < cutoff)
d <- d1[-drop,]
dim(d) # number of genes left

snames <- colnames(counts) # Sample names
status <- substr(snames, 1, nchar(snames) - 2)
time <- substr(snames, nchar(snames) - 1, nchar(snames) - 1)
group <- interaction(time)

plotMDS(d, col = as.numeric(group))

mm <- model.matrix(~0 + group)
y <- voom(d, mm, plot = T)
fit <- lmFit(y, mm)
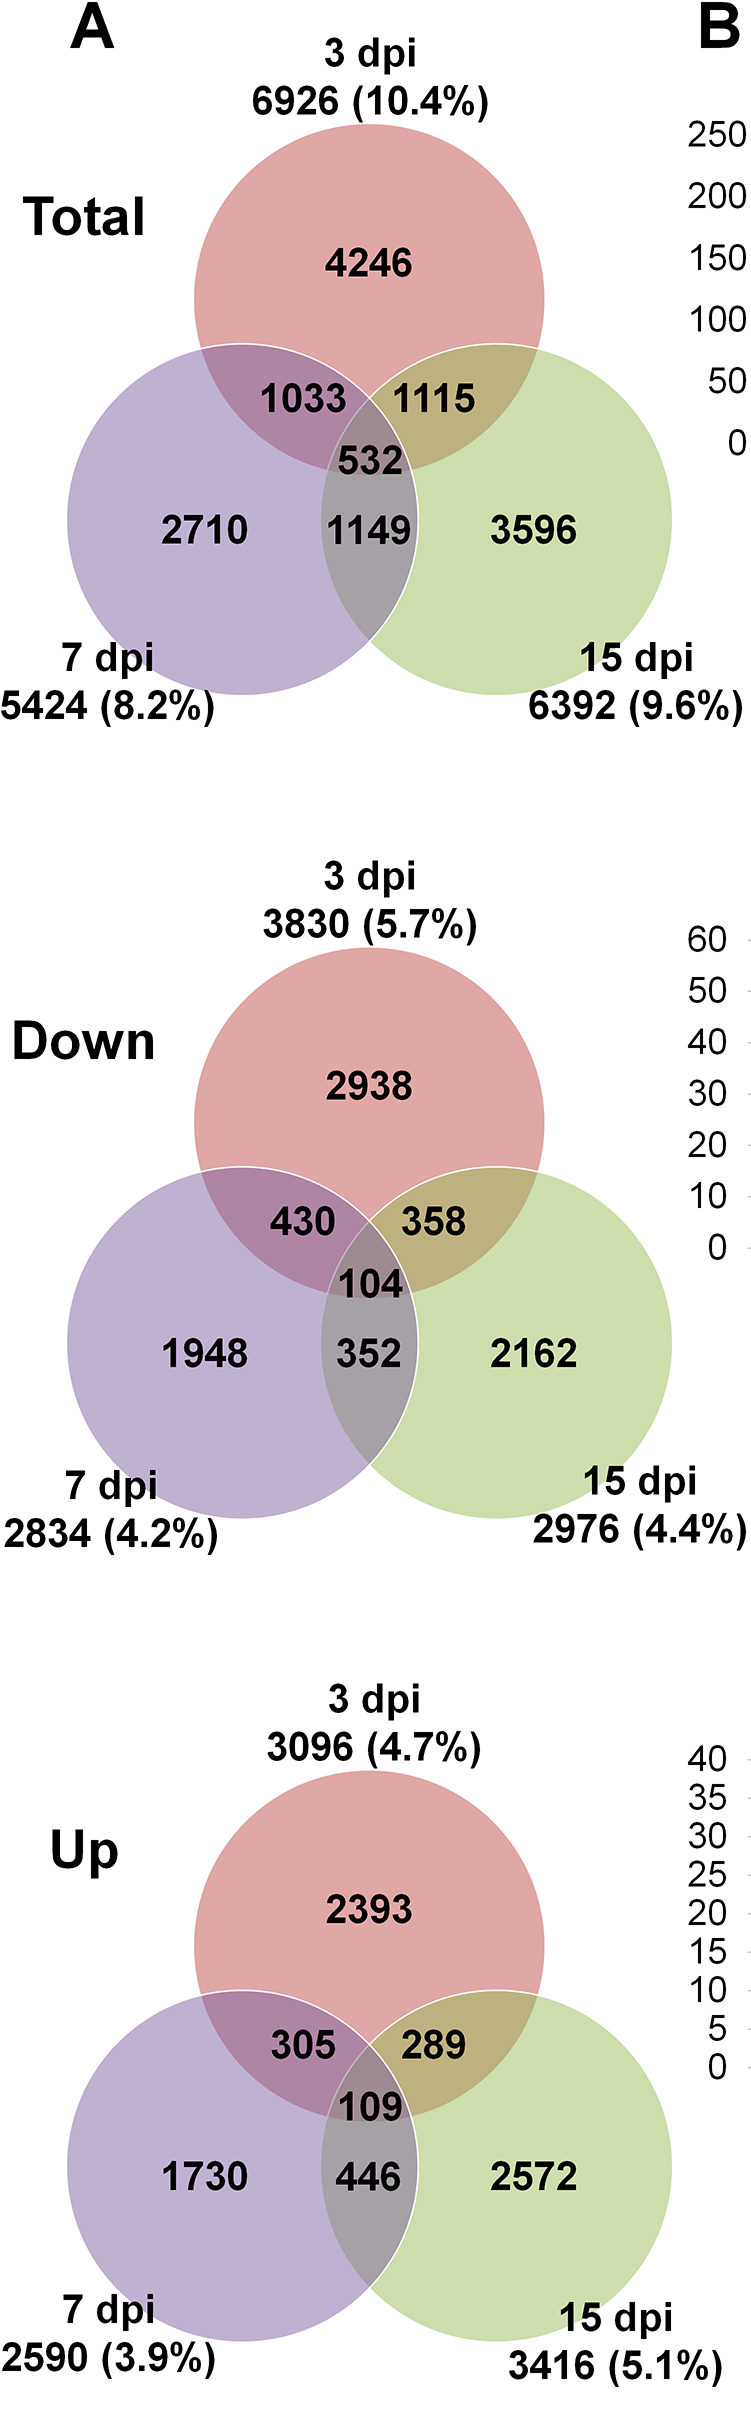
From here I'm not sure how to proceed... I would like to visualize my data as a Venn Diagram that compares total, up-regulated and down-regulated genes among the three different time points (3hpi, 6hpi, 9hpi), like it is shown in this publication for a rice-infecting virus:
So what I tried to do was comparing each of the time points to the Mock infection like so:
#Mock vs 3hpi
contr3 <- makeContrasts(group0 - group3, levels = colnames(coef(fit)))
tmp3 <- contrasts.fit(fit, contr3)
tmp3.2 <- eBayes(tmp3)
top.table3 <- topTable(tmp3.2, sort.by = "P", n = Inf)

length(which(top.table3$adj.P.Val < 0.05))
top.table3$Gene <- rownames(top.table3)
top.table3.2 <- top.table3[,c("Gene", names(top.table3)[1:6])]
write.table(top.table3.2, file = "C0_v_I_time3.txt", row.names = F, sep = "\t", quote = F)
... however, I'm not sure how to merge now those output files if I do that for each time point, or whether this is the proper way to do it to begin with. Also, I'm not sure whether all this even considered the different replicates ... If you know any better way to do the analysis, like a different package, or a solution on how to proceed, I would be immeasurably thankful!

Hey Gordon, thank you for your fast and incredibly helpful reply (and forgive my late reaction ...). I was able to infer the desired Venn-Diagrams, however, the number of doww/up-regulated genes is quite low.
Though, this can be due to my experimental setup and the behaviour of my virus (at least there are correlations in the literature), but I would like to know, is it possible that the limma results can be influenced by how I imported my data into R? For instance, I'm currently trying to use my limma results on EnhancedVolcano but everytime I run the function it says that my adj.p.values aren't numeric. And indeed when I look at my gene counts with str() it shows me that all my values are integers:
I imported the csv file with my gene counts in the following way:
So I guess my main question is: can the way I import my data greatly affect the outcome of the limma analysis, AND could this maybe be the reason why I cannot use my results on EnhancedVolcano or is limma not compatible with it to begin with?
Sorry for the thesis ^^
Best Jirka
You are conflating things that cannot possibly have anything to do with one another. If you have an error from EnhancedVolcano (or any from other similar program) then you have simply made a programming error in entering data into that program. It has nothing to do with limma.
Thanks for your reply! I deleted my Answer post, sorry about this again. I managed to get volcano plots with Glimma now instead, so all good :) Do I need to close this thread in a way to specify that it's solved or do I just leave it like it is now?
OK, good. You can also make volcano plots in limma itself, although I prefer mean-difference plots with plotMD.
Accepting an answer (as you already did above) is the right way to mark the thread as resolved. You can't do that with comments, so just leave them as is. Next time, consider asking followup questions that are distinct from the original question as new questions in a new thread instead of adding them as comments.