
Hello, This is the first time I am posting in a forum of any kind. I will try to commit to the guidelines as much as possible, please be understanding of my mistakes. I can update the post according to your suggestions, obviously.
I have been trying to analyze a RNA-seq dataset from obtained from the field for Arabidopsis. It is originally supposed to include 11 timepoints for an ecotype and 12 timepoints for the other ecotype with 3 replicates each, adding up to 69 samples. The timepoints represent the annual cycle basically. However, 22 samples were lost due to issues in the data storage in the lab responsible as much as I have been informed by the person responsible for the analysis published in a paper. This leaves out some replicates out for certain timepoints while resulting in the loss of two timepoints completely.
I have Fpkm values averaged over replicates for each timepoint, though I found out over a month of struggle that they were no use as my ad-hoc groupings of them were too arbitrary.
The samples for two ecotypes were not collected at the same year, meaning that the experiments for each accessions was conducted in the separate years. This is one of my first problems as I understand I can not differentiate between batch effects and the accessions due this. Two ecotypes are radically different with respect to each other in MDS plots with the 50% variance attributed to the dimension in question.
Since we have the measurements for the field conditions throughout the studies. What I originally planned to do was to use natural regression splines as specified in the limma user guide with respect one of the environmental variables with two accessions specified as an additional factor. Except for the two lost timepoints the samples are distributed continously in their groups over the MDS plot and also distributed continously with respect to temperature with one of the dimensions in both ecotypes.
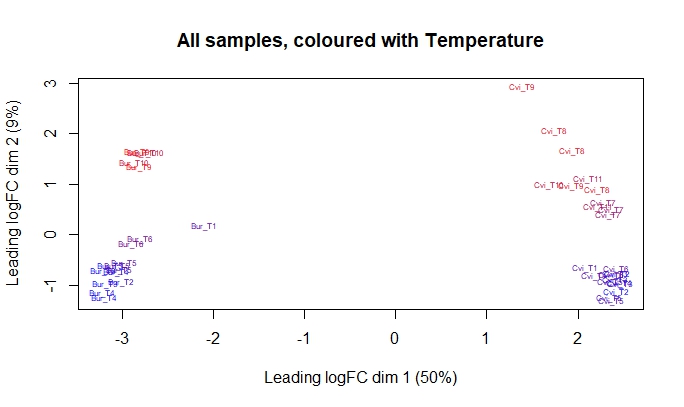
Observing this gradual change in MDS plot, I thought that the dataset should be comparable two ecotypes with respect their response to the temperature. My first set of questions relates to this approach, questioning its the validity and feasiblity;
Is this a valid approach that I could follow, even if it were to be that the samples were not collected in different batches? Could the interaction terms still be regarded as informative, while the between ecotypes comparasions are obviously confounded by the batch effects?
As my aim is mainly identfying the genes that are showing contrasting patterns in response to an environmental variable, should I rather analyze genes within each ecotype independently in response to temperature specified as a continous factor using again the natural splines? In that case, I am in need of an additional method to compare the results for two ecotype. The patterns of the genes can be compared I imagine but I wasn't able to find a method for that.
Nevertheless, as long as the samples have two replicates for a timepoint I can compare them with subsequent timepoints to observe critical transitions.
I appreciate any help or experience out there that can help me find my way with this dataset. With regards.
### For the first approach regarding splines, with temperature as the environmental variable

Ecotype_par <- factor(filter(counts_filterbyexprs$samples, !is.na(Temp))$Ecotype)
Temp_splines <- ns(filter(counts_filterbyexprs$samples, !is.na(Temp))$Temp, df = 3)
sample_names <- filter(counts_filterbyexprs$samples, !is.na(Temp))$sample_name
design = model.matrix(~Ecotype_par*Temp_splines)


sessionInfo( )

R version 4.2.1 (2022-06-23 ucrt)
Platform: x86_64-w64-mingw32/x64 (64-bit)
Running under: Windows 10 x64 (build 19045)

Matrix products: default

attached base packages:
[1] splines   stats4    stats     graphics  grDevices utils     datasets  methods   base

other attached packages:
 [1] topGO_2.48.0                SparseM_1.81                graph_1.74.0
 [4] clusterProfiler_4.4.4       GO.db_3.15.0                DESeq2_1.36.0
 [7] SummarizedExperiment_1.26.1 MatrixGenerics_1.8.1        matrixStats_0.62.0
[10] zFPKM_1.18.0                RColorBrewer_1.1-3          tidyr_1.2.1
[13] dplyr_1.0.10                org.At.tair.db_3.15.1       GenomicFeatures_1.48.4
[16] AnnotationDbi_1.58.0        Biobase_2.56.0              GenomicRanges_1.48.0
[19] GenomeInfoDb_1.32.4         IRanges_2.30.1              S4Vectors_0.34.0
[22] BiocGenerics_0.42.0         edgeR_3.38.4                limma_3.52.4