Entering edit mode

Hi all, is there a way to add a gene expression heatmap option to GOplots::GOChord plot? Or multiple heatmaps at once?
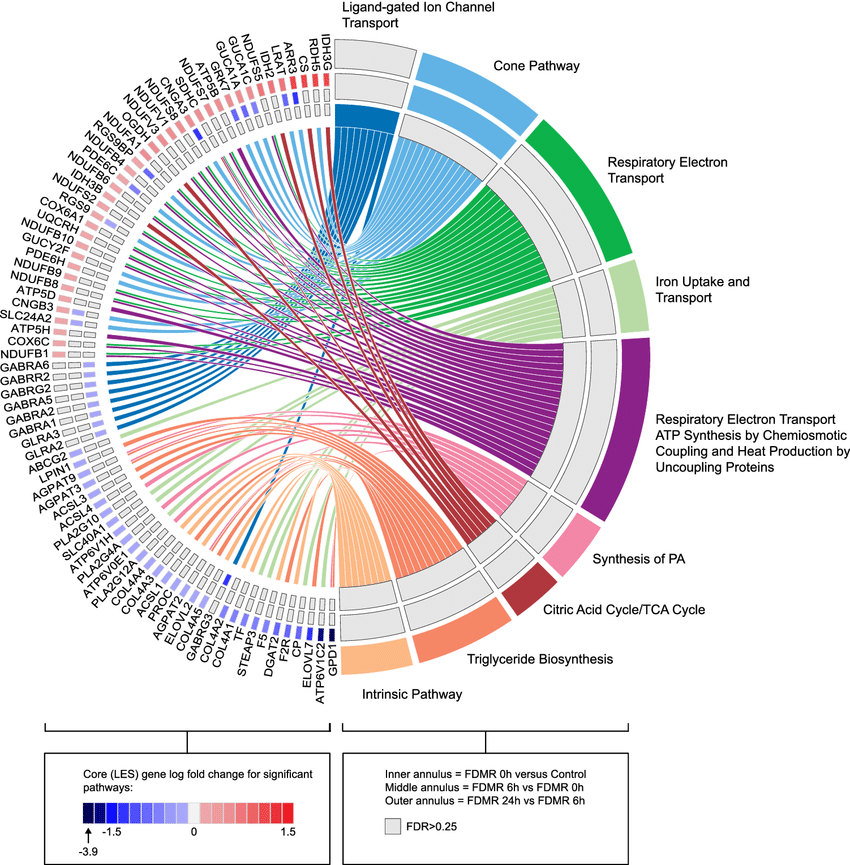
An example Chord plot: Fig 6 in PMID: 33674625.
Here is what I tried:
library(GOplot)
data(EC)
circ <- circle_dat(EC$david, EC$genelist)
chord <- chord_dat(data = circ, genes = EC$genes, process = EC$process)
chord$logFC2 = sample(chord$logFC)
my_test_plot = GOChord(chord, gene.order = 'logFC')
my_test_plot
However, there are no explicit options for heatmaps. Is there a workaround for this?