Potential problem with independent filtering in DESeq2
1
0
Entering edit mode
Stepan • 0
@8a6e6497
Last seen 12 months ago
United States

Hello,

I was routinely using DESeq2 for some small RNA-seq datasets, and suddenly I noticed that FDR corrections are too aggressive. After some investigation, I found out that independent filtering is wrongly determining the optimal threshold:

dds <- DESeqDataSetFromMatrix(countData = counts, colData = groups, design = ~ Group)
sizeFactors(dds) <- size_factors
dds <- DESeq(dds)
res <- results(dds)

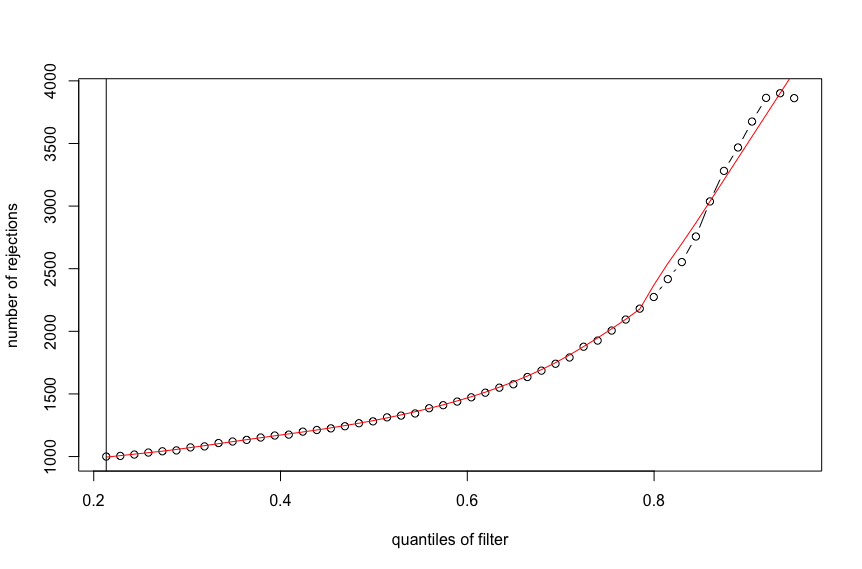
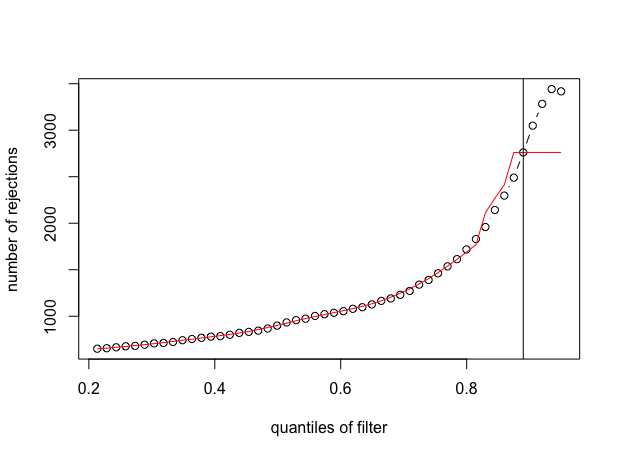
plot(metadata(res)$filterNumRej, 
     type="b", ylab="number of rejections",
     xlab="quantiles of filter")
lines(metadata(res)$lo.fit, col="red")
abline(v=metadata(res)$filterTheta)

enter image description here

Is there any explanation of such a behavior, or I found a bug? Thanks!

sessionInfo()
R version 4.2.1 (2022-06-23)
Platform: x86_64-apple-darwin17.0 (64-bit)
Running under: macOS Ventura 13.1

Matrix products: default
LAPACK: /Library/Frameworks/R.framework/Versions/4.2/Resources/lib/libRlapack.dylib

locale:
[1] en_US.UTF-8/en_US.UTF-8/en_US.UTF-8/C/en_US.UTF-8/en_US.UTF-8

attached base packages:
[1] stats4    stats     graphics  grDevices utils     datasets  methods   base     

other attached packages:
 [1] DESeq2_1.36.0               SummarizedExperiment_1.26.1 Biobase_2.56.0              MatrixGenerics_1.8.1       
 [5] matrixStats_0.62.0          GenomicRanges_1.48.0        GenomeInfoDb_1.32.4         IRanges_2.30.1             
 [9] S4Vectors_0.34.0            BiocGenerics_0.42.0        

loaded via a namespace (and not attached):
 [1] KEGGREST_1.36.3        genefilter_1.78.0      locfit_1.5-9.6         tidyselect_1.2.0       splines_4.2.1         
 [6] lattice_0.20-45        generics_0.1.3         colorspace_2.0-3       vctrs_0.5.0            utf8_1.2.2            
[11] blob_1.2.3             XML_3.99-0.11          survival_3.4-0         rlang_1.0.6            pillar_1.8.1          
[16] glue_1.6.2             DBI_1.1.3              BiocParallel_1.30.4    bit64_4.0.5            RColorBrewer_1.1-3    
[21] GenomeInfoDbData_1.2.8 lifecycle_1.0.3        zlibbioc_1.42.0        Biostrings_2.64.1      munsell_0.5.0         
[26] gtable_0.3.1           codetools_0.2-18       memoise_2.0.1          geneplotter_1.74.0     fastmap_1.1.0         
[31] parallel_4.2.1         fansi_1.0.3            AnnotationDbi_1.58.0   Rcpp_1.0.9             xtable_1.8-4          
[36] scales_1.2.1           cachem_1.0.6           DelayedArray_0.22.0    annotate_1.74.0        XVector_0.36.0        
[41] bit_4.0.4              ggplot2_3.3.6          png_0.1-7              dplyr_1.0.10           grid_4.2.1            
[46] cli_3.4.1              tools_4.2.1            bitops_1.0-7           magrittr_2.0.3         RCurl_1.98-1.9        
[51] RSQLite_2.2.18         tibble_3.1.8           pkgconfig_2.0.3        crayon_1.5.2           Matrix_1.5-1          
[56] httr_1.4.4             R6_2.5.1               compiler_4.2.1
DESeq2 • 990 views
ADD COMMENT
1
Entering edit mode
Stepan • 0
@8a6e6497
Last seen 12 months ago
United States

I did some additional analysis and found the source of problem. As you could see, the red line (lo.fit) is monotonically increasing. Because of that, the threshold value on y axis calculated by

thresh <- max(lo.fit$y) - sqrt(mean(residual^2))

if not reachable by any of points, so any(numRej > thresh) returns FALSE and j = 1.

The source of problem is in using the lowess function with f=1/5. If a peak is close to the right or left, it fails to adequately interpolate the data (I guess because of the non-symmetric window at the array ends). I've generated another pathological example:

enter image description here

From my point of view, this could be classified as a bug. Are there any problems with taking the arg max without any interpolation? 50 dots on a quantile grid looks like a fairly good number for that.

ADD COMMENT
2
Entering edit mode

Yes, there were problems with taking arg max without interpolation. It was overly sensitive to random fluctuations and resulted in extreme filtering not representing any increase in power.

I'll take a look at your example. Could you paste metadata(res)$filterNumRej into a comment box so I can work on it?

ADD REPLY
1
Entering edit mode

Taking a step back, one could also say that the optimal threshold finding for independent filtering is a heuristic without clear performance properties, and should be replaced by IHW, for which mathematical guarantees exist and which should avoid this sort of problems.

ADD REPLY
2
Entering edit mode

Yes, I should have said, IHW is a drop in replacement, see the vignette.

library("IHW")
res <- results(dds, filterFun=ihw)

Nevertheless, I should look into this default behavior and address it, I should get a chance this week.

ADD REPLY
0
Entering edit mode

Hello Michael,

Thank you!

Here is the output for the first figure (red line with monotonic increase):

              theta numRej
21.33803% 0.2133803   1000
22.84134% 0.2284134   1005
24.34464% 0.2434464   1016
25.84795% 0.2584795   1032
27.35125% 0.2735125   1042
28.85456% 0.2885456   1049
30.35787% 0.3035787   1073
31.86117% 0.3186117   1081
33.36448% 0.3336448   1108
34.86778% 0.3486778   1120
36.37109% 0.3637109   1133
37.87439% 0.3787439   1152
39.3777%  0.3937770   1168
40.881%   0.4088100   1175
42.38431% 0.4238431   1199
43.88761% 0.4388761   1212
45.39092% 0.4539092   1225
46.89423% 0.4689423   1242
48.39753% 0.4839753   1266
49.90084% 0.4990084   1281
51.40414% 0.5140414   1313
52.90745% 0.5290745   1327
54.41075% 0.5441075   1344
55.91406% 0.5591406   1386
57.41736% 0.5741736   1410
58.92067% 0.5892067   1439
60.42397% 0.6042397   1473
61.92728% 0.6192728   1510
63.43059% 0.6343059   1550
64.93389% 0.6493389   1577
66.4372%  0.6643720   1635
67.9405%  0.6794050   1686
69.44381% 0.6944381   1741
70.94711% 0.7094711   1791
72.45042% 0.7245042   1877
73.95372% 0.7395372   1926
75.45703% 0.7545703   2006
76.96033% 0.7696033   2094
78.46364% 0.7846364   2181
79.96695% 0.7996695   2274
81.47025% 0.8147025   2417
82.97356% 0.8297356   2553
84.47686% 0.8447686   2757
85.98017% 0.8598017   3037
87.48347% 0.8748347   3281
88.98678% 0.8898678   3468
90.49008% 0.9049008   3675
91.99339% 0.9199339   3864
93.49669% 0.9349669   3901
95%       0.9500000   3862

And here is the output for the second figure (red line with plateau):

              theta numRej
21.33726% 0.2133726    651
22.84058% 0.2284058    656
24.3439%  0.2434390    666
25.84722% 0.2584722    677
27.35054% 0.2735054    681
28.85387% 0.2885387    694
30.35719% 0.3035719    708
31.86051% 0.3186051    713
33.36383% 0.3336383    723
34.86715% 0.3486715    742
36.37047% 0.3637047    755
37.87379% 0.3787379    768
39.37711% 0.3937711    781
40.88044% 0.4088044    786
42.38376% 0.4238376    801
43.88708% 0.4388708    821
45.3904%  0.4539040    832
46.89372% 0.4689372    845
48.39704% 0.4839704    868
49.90036% 0.4990036    899
51.40368% 0.5140368    933
52.90701% 0.5290701    958
54.41033% 0.5441033    974
55.91365% 0.5591365   1003
57.41697% 0.5741697   1022
58.92029% 0.5892029   1037
60.42361% 0.6042361   1054
61.92693% 0.6192693   1080
63.43025% 0.6343025   1097
64.93358% 0.6493358   1127
66.4369%  0.6643690   1165
67.94022% 0.6794022   1191
69.44354% 0.6944354   1230
70.94686% 0.7094686   1272
72.45018% 0.7245018   1340
73.9535%  0.7395350   1390
75.45682% 0.7545682   1462
76.96015% 0.7696015   1536
78.46347% 0.7846347   1614
79.96679% 0.7996679   1718
81.47011% 0.8147011   1830
82.97343% 0.8297343   1959
84.47675% 0.8447675   2142
85.98007% 0.8598007   2297
87.48339% 0.8748339   2490
88.98672% 0.8898672   2761
90.49004% 0.9049004   3049
91.99336% 0.9199336   3283
93.49668% 0.9349668   3442
95%       0.9500000   3418
ADD REPLY
1
Entering edit mode

Thanks for the report and for posting these examples.

I agree it's a bug and have pushed a fix to devel branch (you can obtain this easily using devtools::install_github("mikelove/DESeq2"), v1.39.7.

In terms of scope, I think this is not common. For so many quantiles of the filtering threshold, in most applications the maximum is reached in the middle, before you've tossed 98% of the features. You might benefit from doing a bit more pre-filtering of very low count features in this application anyway, and as Wolfgang said, IHW should perform better than the simple default filtering.

Nevertheless, I agree this was strange behavior for this case you presented and so I've added a check that the default filter will look to see if it can attain 90% of the fitted maximum, or 80% of the fitted maximum if not 90%. This will address these rare cases while also not changing the behavior on the vast majority of RNA-seq datasets, where you don't obtain the maximum near the end of the sequence. Typically the maximum is reached in the middle, such that looking for a point where we are close enough to the maximum in terms of the residual error works fine.

ADD REPLY
0
Entering edit mode

Thank you very much, Michael!

ADD REPLY

Login before adding your answer.

Traffic: 500 users visited in the last hour
Help About
FAQ
Access RSS
API
Stats

Use of this site constitutes acceptance of our User Agreement and Privacy Policy.

Powered by the version 2.3.6