DESeq2 Log fold change strange values for certain genes
1
0
Entering edit mode
Layla • 0
@7afa401c
Last seen 13 months ago
United Kingdom

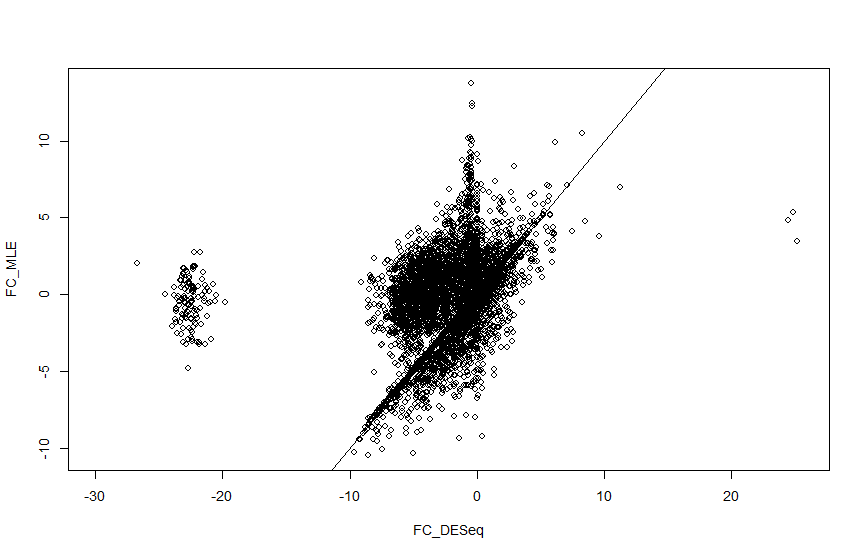
I am analysing single cell seq data from Maynard et al. and I am getting strange log2 fold change values for a cluster of genes when calculated with DESeq2. When I manually calculate the log fold change this doesnt happen, so I cant understand what is causing this. Using code on another help forum I have plotted the log fold change values so you can see the cluster I am talking about (there are also a couple of genes in the positive axis). There seems to be a strange gap with no fold change values coming out between 10 and 20 in both positive and negative directions.

#inputting data and running DESeq2 - DataS1S5 flow is from a csv of raw counts data with samples and counts for each gene 
#and coldata contains the conditions to assign each sample
dds <- DESeqDataSetFromMatrix(countData = DataS1S5Flow, colData = coldata, design = ~condition)

dds <- DESeq(dds)

res <- results(dds)

> head(res)
log2 fold change (MLE): condition S5 vs S1 
Wald test p-value: condition S5 vs S1 
DataFrame with 6 rows and 6 columns
            baseMean log2FoldChange     lfcSE      stat    pvalue      padj
           <numeric>      <numeric> <numeric> <numeric> <numeric> <numeric>
A1BG     5.47265e+00      -2.728897   1.64464 -1.659266 0.0970623  0.468531
A1BG-AS1 2.40010e-01      -1.610200   4.16164 -0.386915 0.6988191        NA
A1CF     0.00000e+00             NA        NA        NA        NA        NA
A2M      2.14842e+03       0.498344   1.11919  0.445270 0.6561244  0.937951
A2M-AS1  8.55214e-02       1.133983   4.15238  0.273092 0.7847823        NA
A2ML1    0.00000e+00             NA        NA        NA        NA        NA

#comparing fold changes:
##DESeq analysis
FC_DESeq <- res$log2FoldChange

#Export the median ratio normalized matrix
cts_norm <- counts(dds, normalized = T)

#Fold change calculated from the normalized matrix
FC_MLE <- apply(cts_norm, 1, function(x)
  log2(mean(x[coldata$condition == "S5"])/mean(x[coldata$condition == "S1"])))

plot(FC_DESeq, FC_MLE)
abline(0, 1)


sessionInfo( )

R version 4.0.3 (2020-10-10)
Platform: x86_64-w64-mingw32/x64 (64-bit)
Running under: Windows 10 x64 (build 19044)

Matrix products: default

locale:
[1] LC_COLLATE=English_United Kingdom.1252  LC_CTYPE=English_United Kingdom.1252    LC_MONETARY=English_United Kingdom.1252
[4] LC_NUMERIC=C                            LC_TIME=English_United Kingdom.1252    

attached base packages:
[1] parallel  stats4    stats     graphics  grDevices utils     datasets  methods   base     

other attached packages:
 [1] PCAtools_2.2.0              pheatmap_1.0.12             ggpubr_0.4.0                rstatix_0.7.0              
 [5] Rmisc_1.5.1                 plyr_1.8.8                  lattice_0.20-41             EnhancedVolcano_1.13.2     
 [9] ggrepel_0.9.1               DESeq2_1.30.1               SummarizedExperiment_1.20.0 Biobase_2.50.0             
[13] MatrixGenerics_1.2.1        matrixStats_0.63.0          GenomicRanges_1.42.0        GenomeInfoDb_1.26.7        
[17] IRanges_2.24.1              S4Vectors_0.28.1            BiocGenerics_0.36.1         forcats_0.5.1              
[21] stringr_1.4.0               dplyr_1.0.9                 purrr_0.3.4                 readr_2.1.2                
[25] tidyr_1.2.0                 tibble_3.1.7                ggplot2_3.3.6               tidyverse_1.3.1            

loaded via a namespace (and not attached):
  [1] utf8_1.2.2                spatstat.explore_3.0-6    reticulate_1.28           tidyselect_1.1.1          RSQLite_2.2.14           
  [6] AnnotationDbi_1.52.0      htmlwidgets_1.6.1         grid_4.0.3                BiocParallel_1.24.1       Rtsne_0.16               
 [11] munsell_0.5.0             codetools_0.2-16          ica_1.0-3                 future_1.32.0             miniUI_0.1.1.1           
 [16] withr_2.5.0               spatstat.random_3.1-3     colorspace_2.0-3          progressr_0.13.0          knitr_1.39               
 [21] rstudioapi_0.13           Seurat_4.3.0.9002         ROCR_1.0-11               tensor_1.5                ggsignif_0.6.3           
 [26] listenv_0.9.0             labeling_0.4.2            bbmle_1.0.25              GenomeInfoDbData_1.2.4    polyclip_1.10-4          
 [31] bit64_4.0.5               farver_2.1.1              coda_0.19-4               parallelly_1.34.0         vctrs_0.4.1              
 [36] generics_0.1.3            xfun_0.31                 R6_2.5.1                  apeglm_1.12.0             rsvd_1.0.5               
 [41] locfit_1.5-9.4            spatstat.utils_3.0-1      bitops_1.0-7              cachem_1.0.7              DelayedArray_0.16.3      
 [46] assertthat_0.2.1          promises_1.2.0.1          scales_1.2.1              gtable_0.3.1              beachmat_2.6.4           
 [51] globals_0.16.2            goftest_1.2-3             rlang_1.0.2               genefilter_1.72.1         splines_4.0.3            
 [56] lazyeval_0.2.2            spatstat.geom_3.0-6       broom_0.8.0               BiocManager_1.30.15       yaml_2.3.7               
 [61] reshape2_1.4.4            abind_1.4-5               modelr_0.1.8              backports_1.4.1           httpuv_1.6.9             
 [66] tools_4.0.3               ellipsis_0.3.2            RColorBrewer_1.1-3        ggridges_0.5.4            Rcpp_1.0.8.3             
 [71] sparseMatrixStats_1.2.1   zlibbioc_1.36.0           RCurl_1.98-1.3            deldir_1.0-6              pbapply_1.7-0            
 [76] cowplot_1.1.1             zoo_1.8-10                SeuratObject_4.1.3        haven_2.5.0               cluster_2.1.0            
 [81] fs_1.6.1                  magrittr_2.0.3            data.table_1.14.8         scattermore_0.8           lmtest_0.9-40            
 [86] reprex_2.0.1              RANN_2.6.1                mvtnorm_1.1-1             fitdistrplus_1.1-8        hms_1.1.1                
 [91] patchwork_1.1.2           mime_0.12                 evaluate_0.20             xtable_1.8-4              XML_3.99-0.6             
 [96] emdbook_1.3.12            readxl_1.4.0              gridExtra_2.3             compiler_4.0.3            bdsmatrix_1.3-6          
[101] KernSmooth_2.23-17        crayon_1.5.2              htmltools_0.5.4           later_1.3.0               tzdb_0.3.0               
[106] geneplotter_1.68.0        lubridate_1.8.0           DBI_1.1.2                 dbplyr_2.2.0              MASS_7.3-53              
[111] Matrix_1.5-3              car_3.1-0                 cli_3.3.0                 igraph_1.3.0              pkgconfig_2.0.3          
[116] numDeriv_2016.8-1.1       sp_1.5-0                  spatstat.sparse_3.0-0     plotly_4.10.1             xml2_1.3.2               
[121] annotate_1.68.0           dqrng_0.3.0               XVector_0.30.0            rvest_1.0.2               digest_0.6.29            
[126] sctransform_0.3.5         RcppAnnoy_0.0.20          spatstat.data_3.0-0       rmarkdown_2.20            cellranger_1.1.0         
[131] leiden_0.4.3              uwot_0.1.14               DelayedMatrixStats_1.12.3 shiny_1.7.4               nlme_3.1-149             
[136] lifecycle_1.0.1           jsonlite_1.8.4            carData_3.0-5             viridisLite_0.4.1         fansi_1.0.3              
[141] pillar_1.8.1              fastmap_1.1.1             httr_1.4.5                survival_3.2-7            glue_1.6.2               
[146] png_0.1-8                 bit_4.0.4                 stringi_1.7.6             blob_1.2.3                BiocSingular_1.6.0       
[151] memoise_2.0.1             irlba_2.3.5.1             future.apply_1.10.0

Graph showing cluster with large log fold change values by DESeq2

DESeq2 • 1.2k views
ADD COMMENT
0
Entering edit mode
@mikelove
Last seen 1 day ago
United States

Can you plot the shrunken LFC using lfcShrink.

If you have multiple groups, you can have undefined LFC via the GLM. E.g. log2(0/0).

The shrunken LFC will give you a reliable value that you can plot.

ADD COMMENT
0
Entering edit mode

I have tried plotting that and I just get many zero values?

#extract normalised counts
normCounts <- estimateSizeFactors(dds)
normCounts <- counts(normCounts, normalized=TRUE)

#exclude genes with low normalised counts
idx <- rowSums( normCounts >= 5 ) >= 3
normCounts <- normCounts[idx,]

#calculate fold change manually
S1NC <- normCounts[,rownames(coldata[coldata$condition == "S1",])]
S5NC <- normCounts[,rownames(coldata[coldata$condition == "S5",])]

S1Means <- rowMeans(S1NC)
S5Means <- rowMeans(S5NC)

Genes <- rownames(S1NC)

GroupMeans <- cbind(S1Means, S5Means)
GroupMeans <- as.data.frame(GroupMeans)
GroupMeans$FC <- GroupMeans[,"S1Means"]/GroupMeans[,"S5Means"]
GroupMeans$LogFC <- log2(GroupMeans$FC)

#comparing fold changes:
##Actual analysis
resLFC <- lfcShrink(dds, coef="condition_S5_vs_S1", type="apeglm")
FC_DESeq <- resLFC$log2FoldChange

#Export the median ratio normalized matrix
cts_norm <- counts(dds, normalized = T)
#Fold change calculated from the normalized matrix
FC_MLE <- apply(cts_norm, 1, function(x)
  log2(mean(x[coldata$condition == "S5"])/mean(x[coldata$condition == "S1"])))

plot(FC_DESeq, FC_MLE)
abline(0, 1)

# number of FC got reversed
sum(FC_DESeq * FC_MLE < 0)

plot showing different calculations of log fold change

ADD REPLY
0
Entering edit mode

This also gives an unexpected volcano plot:Volcano plot using LFCShrink

ADD REPLY
0
Entering edit mode

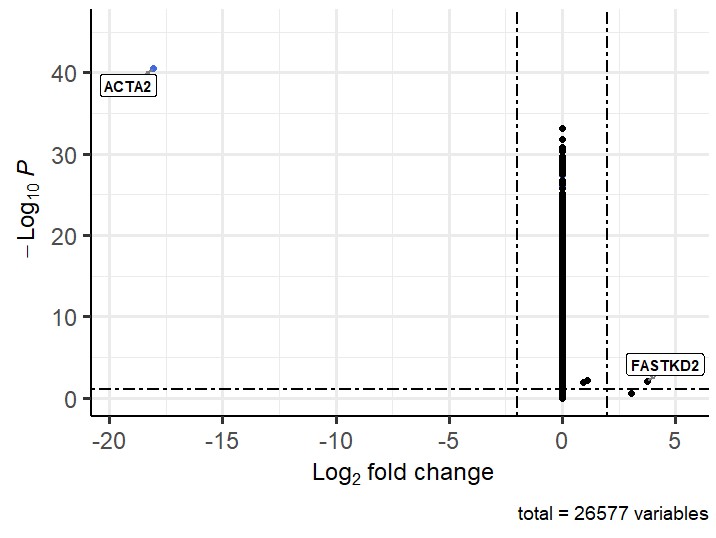
My guess is that the groups are too heterogenous to combine them and you should just run pairs, like so:

dds_sub <- dds[,dds$condition %in% c("S1","S5")]
dds_sub$condition <- droplevels(dds_sub$condition)
dds_sub <- DESeq(dds_sub)
ADD REPLY
0
Entering edit mode

Hi Michael, thanks for your help with this.

I have run your suggestion above in combination with Lfcshrink and the log fold change values now seem sensible but the p values seem wrong. I have attached a volcano plot showing the problem. The cluster that is sitting centrally seems to be the cluster I previously had large negative fold change values for that was clustering on the left (which I still get if I dont perform lfcshrink). Any suggestion for the strange p-values? Thanks

Volcano plot showing result of trying dds_sub

ADD REPLY
0
Entering edit mode

Can you show code where you are getting the LFC and p-value? I'm suggesting to use the subsetting for both LFC and p-value estimation

ADD REPLY
0
Entering edit mode
#generate DESeq data set from counts data
dds <- DESeqDataSetFromMatrix(countData = DataS1S5Flow, colData = coldata, design = ~condition)

#subset
dds_sub <- dds[,dds$condition %in% c("S1","S5")]
dds_sub$condition <- droplevels(dds_sub$condition)

#run DESeq
dds_sub <- DESeq(dds_sub)

#results
res <- results(dds_sub)

#LFC shrinkage of results
resLFC <- lfcShrink(dds_sub, coef="condition_S5_vs_S1", type="apeglm")

#volcano plot of results
VolLFC <- EnhancedVolcano(resLFC, 
                          lab=row.names(resLFC), 
                          x = 'log2FoldChange', 
                          y = 'pvalue',
                          selectLab = NULL,
                          pointSize = 2.0,
                          labSize = 4.0,
                          labCol = 'black',
                          labFace = 'bold',
                          max.overlaps = 10,
                          boxedLabels = TRUE,
                          drawConnectors = TRUE,
                          widthConnectors = 1,
                          colConnectors = 'grey50',
                          title = 'CAF-S5 compared to CAF-S1',
                          subtitle = '',
                          pCutoff = 10e-2,
                          FCcutoff = 2,
                          cutoffLineType = 'twodash',
                          cutoffLineWidth = 0.8,
                          colCustom = keyvals,
                          colAlpha = 1,
                          legendPosition = 'right',
                          legendLabSize = 16,
                          legendIconSize = 5.0)
plot(VolLFC)
ADD REPLY

Login before adding your answer.

Traffic: 747 users visited in the last hour
Help About
FAQ
Access RSS
API
Stats

Use of this site constitutes acceptance of our User Agreement and Privacy Policy.

Powered by the version 2.3.6