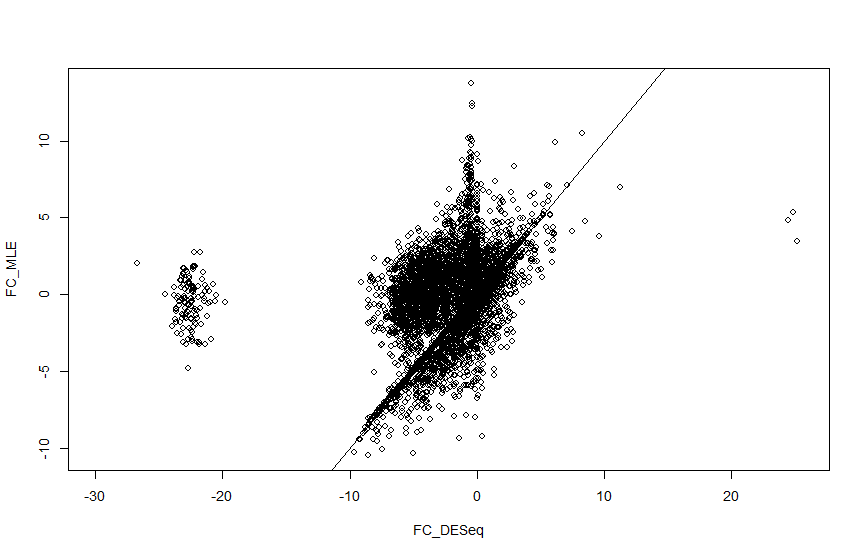
I am analysing single cell seq data from Maynard et al. and I am getting strange log2 fold change values for a cluster of genes when calculated with DESeq2. When I manually calculate the log fold change this doesnt happen, so I cant understand what is causing this. Using code on another help forum I have plotted the log fold change values so you can see the cluster I am talking about (there are also a couple of genes in the positive axis). There seems to be a strange gap with no fold change values coming out between 10 and 20 in both positive and negative directions.
#inputting data and running DESeq2 - DataS1S5 flow is from a csv of raw counts data with samples and counts for each gene
#and coldata contains the conditions to assign each sample
dds <- DESeqDataSetFromMatrix(countData = DataS1S5Flow, colData = coldata, design = ~condition)

dds <- DESeq(dds)

res <- results(dds)

> head(res)
log2 fold change (MLE): condition S5 vs S1
Wald test p-value: condition S5 vs S1
DataFrame with 6 rows and 6 columns
            baseMean log2FoldChange     lfcSE      stat    pvalue      padj
           <numeric>      <numeric> <numeric> <numeric> <numeric> <numeric>
A1BG     5.47265e+00      -2.728897   1.64464 -1.659266 0.0970623  0.468531
A1BG-AS1 2.40010e-01      -1.610200   4.16164 -0.386915 0.6988191        NA
A1CF     0.00000e+00             NA        NA        NA        NA        NA
A2M      2.14842e+03       0.498344   1.11919  0.445270 0.6561244  0.937951
A2M-AS1  8.55214e-02       1.133983   4.15238  0.273092 0.7847823        NA
A2ML1    0.00000e+00             NA        NA        NA        NA        NA

#comparing fold changes:
##DESeq analysis
FC_DESeq <- res$log2FoldChange

#Export the median ratio normalized matrix
cts_norm <- counts(dds, normalized = T)

#Fold change calculated from the normalized matrix
FC_MLE <- apply(cts_norm, 1, function(x)
  log2(mean(x[coldata$condition == "S5"])/mean(x[coldata$condition == "S1"])))

plot(FC_DESeq, FC_MLE)
abline(0, 1)


sessionInfo( )

R version 4.0.3 (2020-10-10)
Platform: x86_64-w64-mingw32/x64 (64-bit)
Running under: Windows 10 x64 (build 19044)

Matrix products: default

locale:
[1] LC_COLLATE=English_United Kingdom.1252  LC_CTYPE=English_United Kingdom.1252    LC_MONETARY=English_United Kingdom.1252
[4] LC_NUMERIC=C                            LC_TIME=English_United Kingdom.1252

attached base packages:
[1] parallel  stats4    stats     graphics  grDevices utils     datasets  methods   base

other attached packages:
 [1] PCAtools_2.2.0              pheatmap_1.0.12             ggpubr_0.4.0                rstatix_0.7.0
 [5] Rmisc_1.5.1                 plyr_1.8.8                  lattice_0.20-41             EnhancedVolcano_1.13.2
 [9] ggrepel_0.9.1               DESeq2_1.30.1               SummarizedExperiment_1.20.0 Biobase_2.50.0
[13] MatrixGenerics_1.2.1        matrixStats_0.63.0          GenomicRanges_1.42.0        GenomeInfoDb_1.26.7
[17] IRanges_2.24.1              S4Vectors_0.28.1            BiocGenerics_0.36.1         forcats_0.5.1
[21] stringr_1.4.0               dplyr_1.0.9                 purrr_0.3.4                 readr_2.1.2
[25] tidyr_1.2.0                 tibble_3.1.7                ggplot2_3.3.6               tidyverse_1.3.1

loaded via a namespace (and not attached):
  [1] utf8_1.2.2                spatstat.explore_3.0-6    reticulate_1.28           tidyselect_1.1.1          RSQLite_2.2.14
  [6] AnnotationDbi_1.52.0      htmlwidgets_1.6.1         grid_4.0.3                BiocParallel_1.24.1       Rtsne_0.16
 [11] munsell_0.5.0             codetools_0.2-16          ica_1.0-3                 future_1.32.0             miniUI_0.1.1.1
 [16] withr_2.5.0               spatstat.random_3.1-3     colorspace_2.0-3          progressr_0.13.0          knitr_1.39
 [21] rstudioapi_0.13           Seurat_4.3.0.9002         ROCR_1.0-11               tensor_1.5                ggsignif_0.6.3
 [26] listenv_0.9.0             labeling_0.4.2            bbmle_1.0.25              GenomeInfoDbData_1.2.4    polyclip_1.10-4
 [31] bit64_4.0.5               farver_2.1.1              coda_0.19-4               parallelly_1.34.0         vctrs_0.4.1
 [36] generics_0.1.3            xfun_0.31                 R6_2.5.1                  apeglm_1.12.0             rsvd_1.0.5
 [41] locfit_1.5-9.4            spatstat.utils_3.0-1      bitops_1.0-7              cachem_1.0.7              DelayedArray_0.16.3
 [46] assertthat_0.2.1          promises_1.2.0.1          scales_1.2.1              gtable_0.3.1              beachmat_2.6.4
 [51] globals_0.16.2            goftest_1.2-3             rlang_1.0.2               genefilter_1.72.1         splines_4.0.3
 [56] lazyeval_0.2.2            spatstat.geom_3.0-6       broom_0.8.0               BiocManager_1.30.15       yaml_2.3.7
 [61] reshape2_1.4.4            abind_1.4-5               modelr_0.1.8              backports_1.4.1           httpuv_1.6.9
 [66] tools_4.0.3               ellipsis_0.3.2            RColorBrewer_1.1-3        ggridges_0.5.4            Rcpp_1.0.8.3
 [71] sparseMatrixStats_1.2.1   zlibbioc_1.36.0           RCurl_1.98-1.3            deldir_1.0-6              pbapply_1.7-0
 [76] cowplot_1.1.1             zoo_1.8-10                SeuratObject_4.1.3        haven_2.5.0               cluster_2.1.0
 [81] fs_1.6.1                  magrittr_2.0.3            data.table_1.14.8         scattermore_0.8           lmtest_0.9-40
 [86] reprex_2.0.1              RANN_2.6.1                mvtnorm_1.1-1             fitdistrplus_1.1-8        hms_1.1.1
 [91] patchwork_1.1.2           mime_0.12                 evaluate_0.20             xtable_1.8-4              XML_3.99-0.6
 [96] emdbook_1.3.12            readxl_1.4.0              gridExtra_2.3             compiler_4.0.3            bdsmatrix_1.3-6
[101] KernSmooth_2.23-17        crayon_1.5.2              htmltools_0.5.4           later_1.3.0               tzdb_0.3.0
[106] geneplotter_1.68.0        lubridate_1.8.0           DBI_1.1.2                 dbplyr_2.2.0              MASS_7.3-53
[111] Matrix_1.5-3              car_3.1-0                 cli_3.3.0                 igraph_1.3.0              pkgconfig_2.0.3
[116] numDeriv_2016.8-1.1       sp_1.5-0                  spatstat.sparse_3.0-0     plotly_4.10.1             xml2_1.3.2
[121] annotate_1.68.0           dqrng_0.3.0               XVector_0.30.0            rvest_1.0.2               digest_0.6.29
[126] sctransform_0.3.5         RcppAnnoy_0.0.20          spatstat.data_3.0-0       rmarkdown_2.20            cellranger_1.1.0
[131] leiden_0.4.3              uwot_0.1.14               DelayedMatrixStats_1.12.3 shiny_1.7.4               nlme_3.1-149
[136] lifecycle_1.0.1           jsonlite_1.8.4            carData_3.0-5             viridisLite_0.4.1         fansi_1.0.3
[141] pillar_1.8.1              fastmap_1.1.1             httr_1.4.5                survival_3.2-7            glue_1.6.2
[146] png_0.1-8                 bit_4.0.4                 stringi_1.7.6             blob_1.2.3                BiocSingular_1.6.0
[151] memoise_2.0.1             irlba_2.3.5.1             future.apply_1.10.0


I have tried plotting that and I just get many zero values?
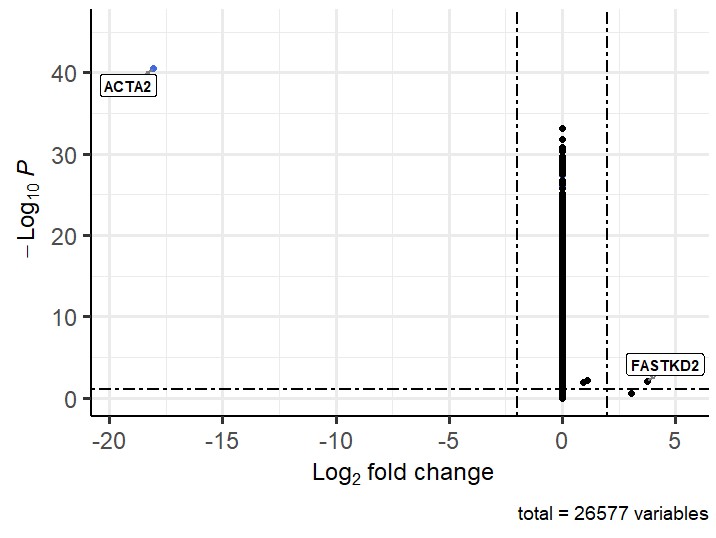
This also gives an unexpected volcano plot:
My guess is that the groups are too heterogenous to combine them and you should just run pairs, like so:
Hi Michael, thanks for your help with this.
I have run your suggestion above in combination with Lfcshrink and the log fold change values now seem sensible but the p values seem wrong. I have attached a volcano plot showing the problem. The cluster that is sitting centrally seems to be the cluster I previously had large negative fold change values for that was clustering on the left (which I still get if I dont perform lfcshrink). Any suggestion for the strange p-values? Thanks
Can you show code where you are getting the LFC and p-value? I'm suggesting to use the subsetting for both LFC and p-value estimation