DESeq2 pvalues overly conservative
1
0
Entering edit mode
gdolsten • 0
@bf72196f
Last seen 12 months ago
United States

Hi, 
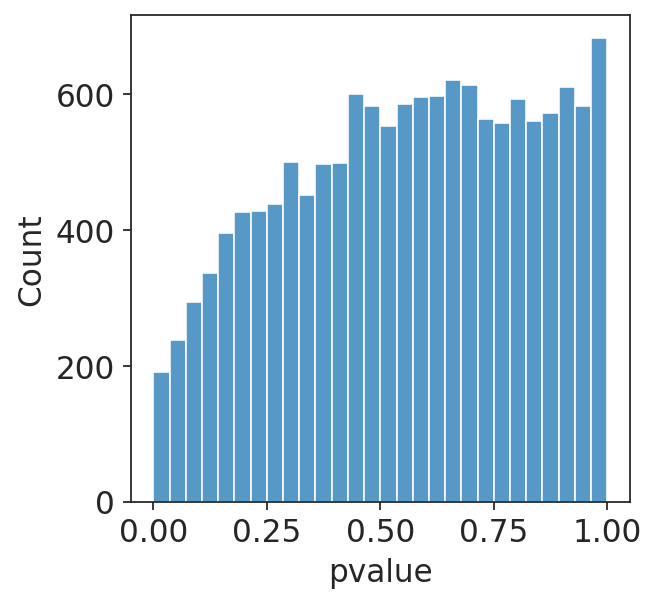
I am running a DESeq2 analysis for some data. I have two different conditions in my data which should have identical RNA-seq at day 0 (I am doing a time course experiment). However, when I run them through DESeq2, I get a hill-shaped pvalue distribution (plotting non-adjusted p-values), shown below. Do you have any idea why this might be? enter image description here

DESeq2 • 449 views
ADD COMMENT
1
Entering edit mode
@james-w-macdonald-5106
Last seen 10 hours ago
United States

In my experience, that is relatively easily fixed by using svaseq from the sva package to generate some surrogate variables to account for unobserved variability.

ADD COMMENT
0
Entering edit mode

Thanks! Great suggestion. I understand the idea of generating orthogonal vectors for your observations if you have a binary comparison. Do you have any intuition for how many surrogate variables to include, or to understand if this is somehow overfitting/how much variance is being explained?

ADD REPLY

Login before adding your answer.

Traffic: 418 users visited in the last hour
Help About
FAQ
Access RSS
API
Stats

Use of this site constitutes acceptance of our User Agreement and Privacy Policy.

Powered by the version 2.3.6