Entering edit mode
Hi,
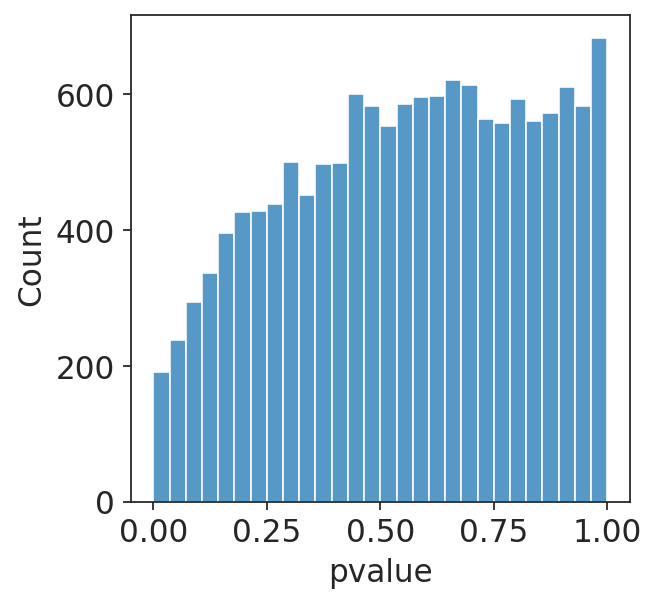
I am running a DESeq2 analysis for some data. I have two different conditions in my data which should have identical RNA-seq at day 0 (I am doing a time course experiment). However, when I run them through DESeq2, I get a hill-shaped pvalue distribution (plotting non-adjusted p-values), shown below. Do you have any idea why this might be?


Thanks! Great suggestion. I understand the idea of generating orthogonal vectors for your observations if you have a binary comparison. Do you have any intuition for how many surrogate variables to include, or to understand if this is somehow overfitting/how much variance is being explained?