
Hi everyone,
I performed a meta-analysis using RankProd (with the RankSum option as my dataset was too big) on expression data.
I plotted the results of RankProd using a volcano plot and the result is a volcano plot shifted to the left as shown in the figure below.
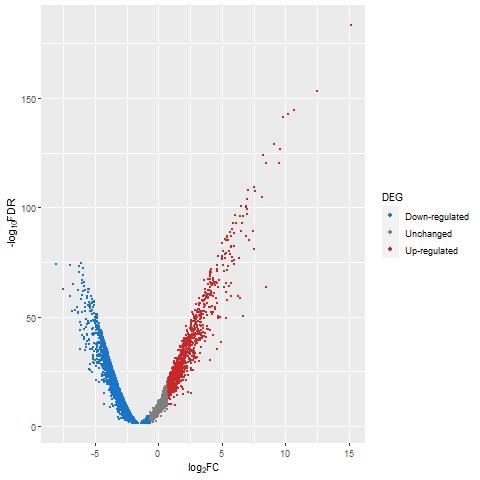
The expression data comes from two different bulk RNA-seq experiments, both matrices have been independentely normalized to cpm and then merged to create the input matrix of RankProducts(). The matrix was log2-transformed before the RankSum analysis.
From the figure I undestrand that there are some problems with the pvalue, but the pvalues are given by the rankproducts function, so I do not really know how to work on them. I am not sure whether I am ignoring the input format of rankProducts and maybe log-tranformed cpm are not the right input for the function, but I haven't found anything so far.