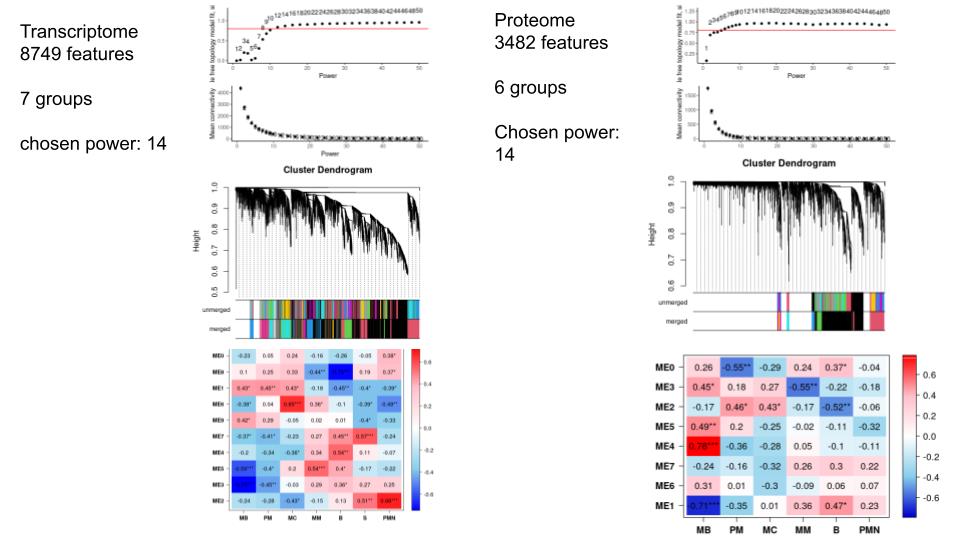
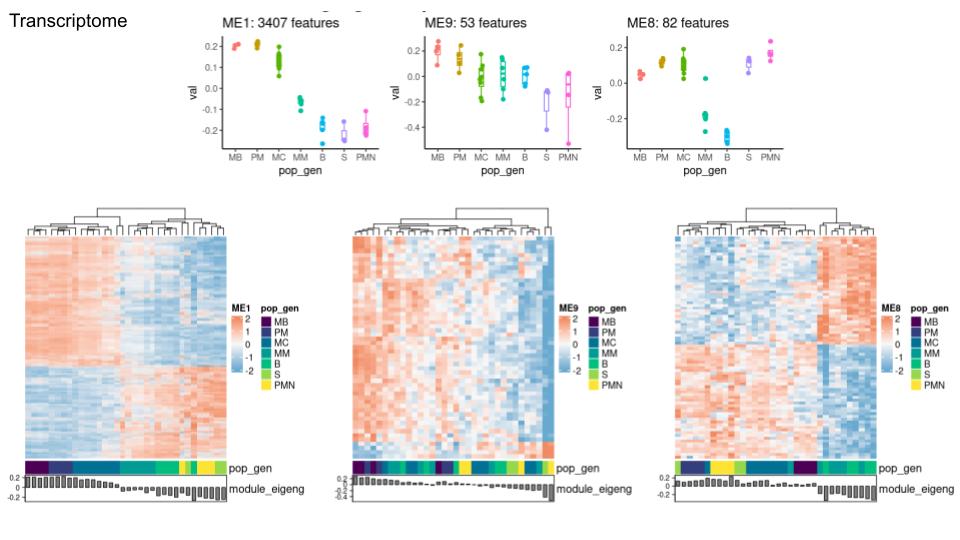
In a WGCNA analysis of transcriptome and proteome of a white blood cell in development (in 6 stages), I find in most modules (especially the large ones) over, as well as underexpressed features, but I am using a signed network type.
I attach some of the graphs and results below. This is my first time running a WGCNA analysis and it's hard for me to deduct meaning from some of the graphical outputs. Would it be great if you could give me tips to better understand the outputs and explain why I get a mix of over and underexpressed features? A final question would be if it matters if some of the groups are highly similar. (eg: the last 3 stages are highly similar on proteome level). Does this throw off the analysis? Should I unite them into one group?
Data: transcriptome as tpm with vsn normalisation proteome as intensity with vsn normalisation Both data batch effect free
Thank you very much!
Sebastian
# network build
   bwnet_mrn <- blockwiseModules(exp_4wgcna_mrn,
                              maxBlockSize = ncol(exp_4wgcna_mrn),
                              TOMType = 'signed',
                              power = soft_power_mrn,
                              mergeCutHeight = 0.25,
                              numericLabels = T,
                              randomSeed = 3234,
                              verbose = 3)


answered in Biostars: https://www.biostars.org/p/9564943/