Interpret plots from DiffBind
1
0
Entering edit mode
Chris • 0
@3fdb6f97
Last seen 17 hours ago
United States

Hi all, I have 4 samples which are 4 conditions but when I made some plots, I got only 2 conditions. enter image description here!

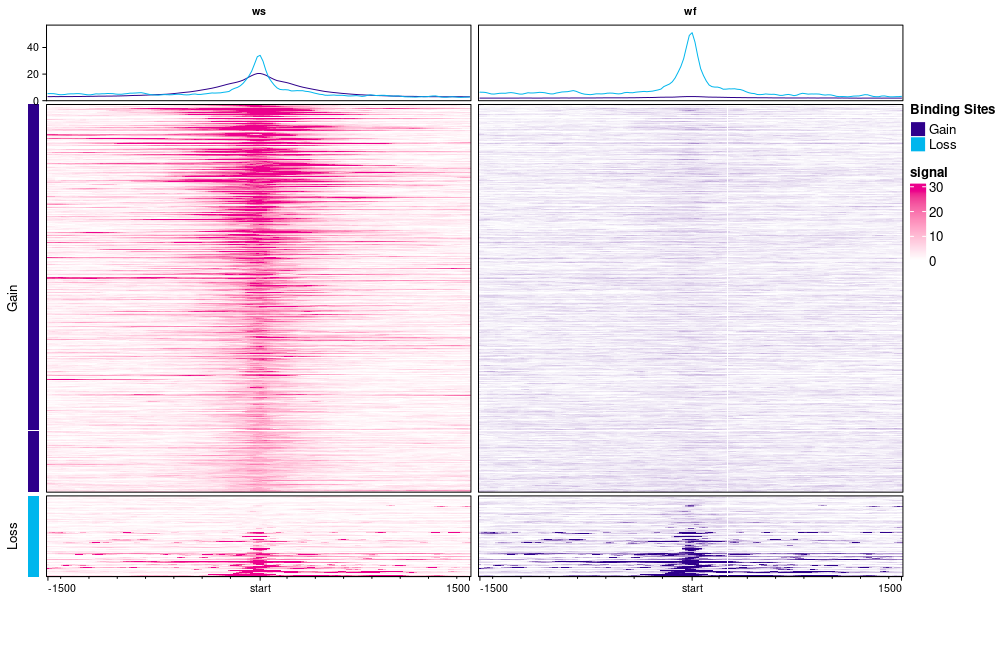
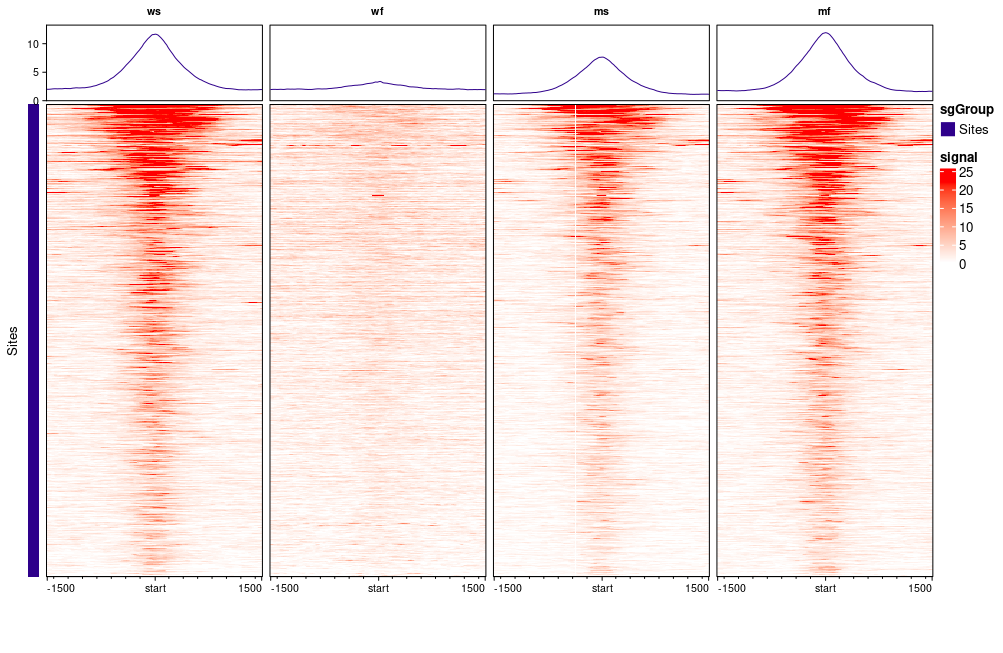
Does this plot mean ws has chromatin more chromatin open (gain) than wf sample? When I rerun the code, I got all 4 conditions but the plot is quite different. There are no gain and loss but only sites. Thank you so much! enter image description here

DiffBind • 759 views
ADD COMMENT
1
Entering edit mode
Rory Stark ★ 5.2k
@rory-stark-5741
Last seen 15 days ago
Cambridge, UK

This is duplicated on Biostars with discussion: https://www.biostars.org/p/9566493/#9567480

ADD COMMENT
0
Entering edit mode

Hi Rory Stark, after I run all the code (post-analysis), when I plot, I got only 2 samples which I don't know why. Would you have a suggestion?

ADD REPLY

Login before adding your answer.

Traffic: 572 users visited in the last hour
Help About
FAQ
Access RSS
API
Stats

Use of this site constitutes acceptance of our User Agreement and Privacy Policy.

Powered by the version 2.3.6