Hello,
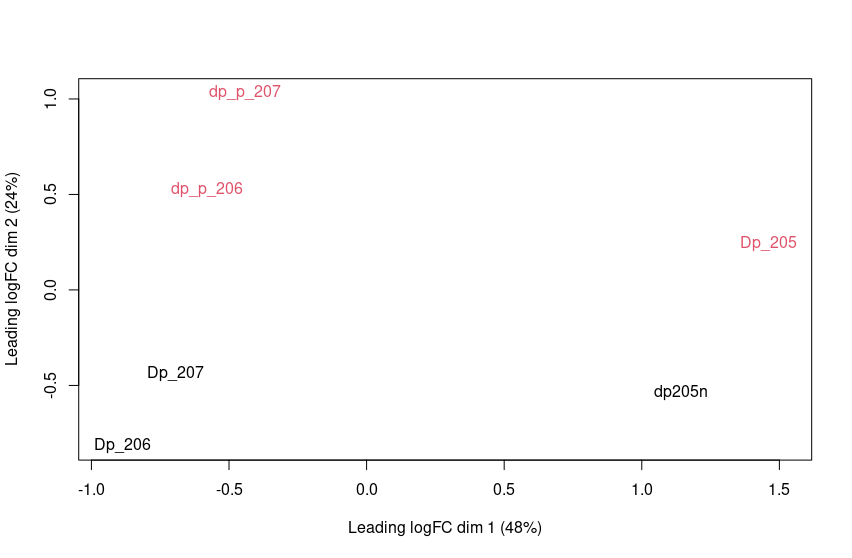
I have 6 RNA-Seq samples, 3 for each condition and am performing RNA-Seq analysis using EdgeR to filter & TMM-Normalize counts then using Limma-VoomwithQuality Weights. My MDS plot looks like this:
Red is treated and Black is untreated, The numbers "205,206,207" represent a different mouse. 205 seems show high variation from 207 & 206 across dimension 1 while expected variation is shown in Dimension 2. Should I do any more normalization or control for bath effects?
Thanks, Sara


