I analysed the enrichment GO using 'enrichGO' for two datasets independently. As suggested in this publication (https://github.com/GuangchuangYu/enrichment4GTEx_clusterProfiler), I combined the two enrichment results using 'merge_result'. On the next step of my analysis, I would like to use 'simplify' function and then performed the cnet analysis. However, I'm encountering the follow error: Error in if (x@fun != "enrichGO" && x@fun != "groupGO" && x@fun != "gseGO") { : missing value where TRUE/FALSE needed.
There is a way to perform the simplify with the combined enrichment results?
Yes, that is possible. See my example code below. Yet, please note that I followed a slightly different workflow than you did.
Main difference is that I perform a combined analysis of the two datasets; that is perform a joint enrichGO analysis already on the 2 lists of input genes using the function compareCluster (and that I did not combine/merge the results of 2 independent enrichGO analyses). The resulting compareClusterResult-object is then used as input for the function simplify, and ultimately plotted.
> ## load library
> library(clusterProfiler)
>
> ## load sample data, en generate 2 lists of input genes
> ## that partially overlap
> data(geneList, package = "DOSE")
> de1 <- names(geneList)[1:350]
> de2 <- names(geneList)[251:450]
>
> ## combine the 2 lists of genes in an R-list
> comb.input <- list("Dataset 1" = de1,
+ "Dataset 2" = de2)
>
> ## run the compareCluster function ...
> res.cC <- compareCluster(geneClusters = comb.input,
+ pAdjustMethod = "BH",
+ pvalueCutoff = 0.05,
+ keyType = "ENTREZID",
+ OrgDb = "org.Hs.eg.db",
+ readable = TRUE,
+ ont = "BP",
+ fun = "enrichGO")
>
> ## ... followed by the simplify function
> res.simplify <- clusterProfiler::simplify(x = res.cC, cutoff = 0.7)
>
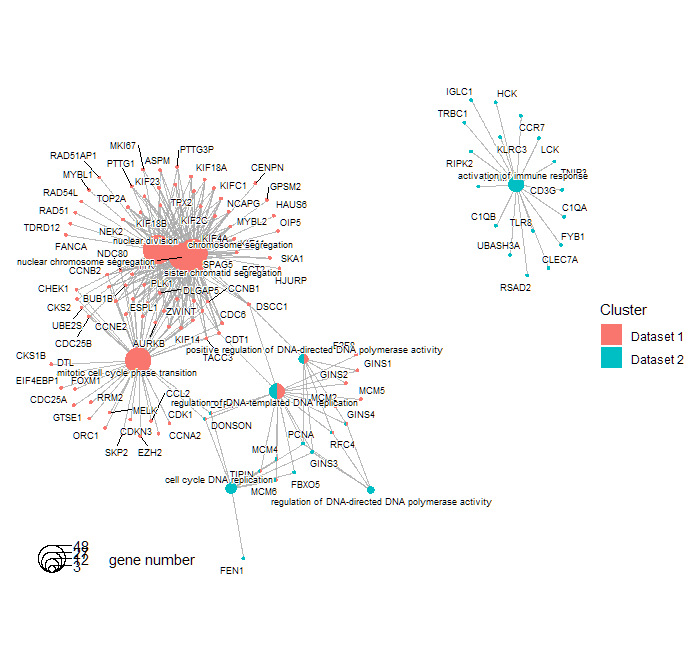
> ## finally, visualize results in a cnetplot
> cnetplot(res.simplify)
Warning message:
ggrepel: 16 unlabeled data points (too many overlaps). Consider increasing max.overlaps
>
> packageVersion("clusterProfiler")
[1] '4.8.2'
>
>


Hi Guido, your approach works beautifully. Thank you :)