Cluster profiler emap plot - what are the annotations?
1
0
Entering edit mode
fluentin44 • 0
@45f45212
Last seen 7 months ago
United Kingdom

Hi,

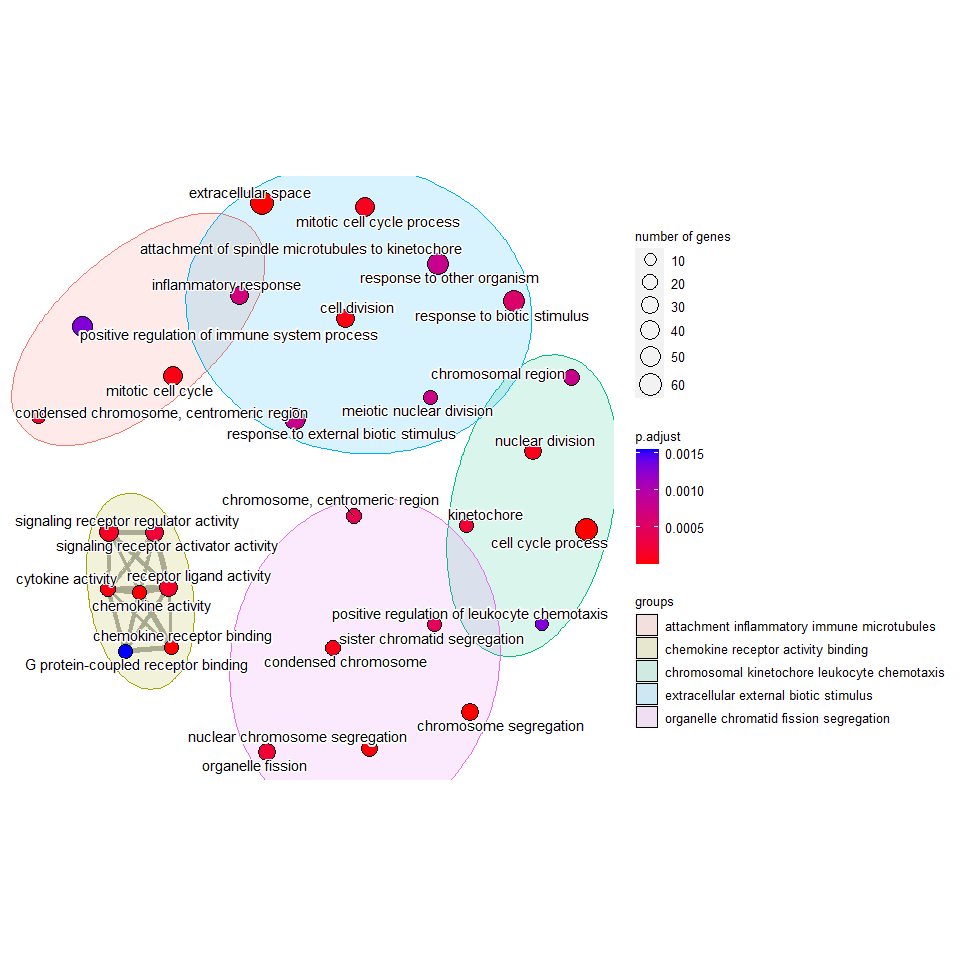
Using clusterprofiler an generated an emap plot from my enrichment data - would anyone be able to tell me where the grouping terms (bottom right) come from / how they are made? They look potentially like they are just picking common words?

emap plot

Thanks, Matt

clusterProfiler emapplot • 840 views
ADD COMMENT
1
Entering edit mode
Guido Hooiveld ★ 3.9k
@guido-hooiveld-2020
Last seen 12 hours ago
Wageningen University, Wageningen, the …

Yes, these (the groups) are indeed 'high frequency words' present in the terms/descriptions of the gene set; identified analogous when creating a word cloud.

This is indeed not clearly stated at the help page for the function emapplot, but it becomes obvious if you check the source code at line 523:

https://github.com/YuLab-SMU/enrichplot/blob/ce94b308d0ce5e835117bacd8858aadf2b2de9bc/R/emapplot_utilities.R#L523C44-L524

... you will notice that there the internal function get_wordcloud is called, which can be found here: https://github.com/YuLab-SMU/enrichplot/blob/ce94b308d0ce5e835117bacd8858aadf2b2de9bc/R/wordcloud.R#L26

ADD COMMENT
0
Entering edit mode

Absolutely brilliant, thanks for a definitive answer!

Thanks, Matt

ADD REPLY

Login before adding your answer.

Traffic: 566 users visited in the last hour
Help About
FAQ
Access RSS
API
Stats

Use of this site constitutes acceptance of our User Agreement and Privacy Policy.

Powered by the version 2.3.6