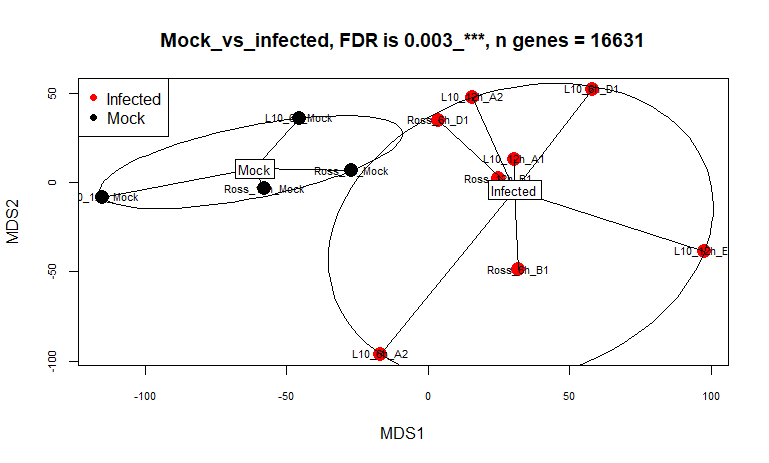
I am running EdgeR pipeline on an RNA seq data comparing two condition (mock; 2 samples vs infected ; 10 samples) while adjusting for time points. I normalized using TMM method, and then fitted generalized linear model (glmQLFit) on the data and then run DE test using (glmQLFTest)
When I checked the summary of the decideTests, no genes were sig DE at 0.05 or even 0.1 cutoff. I looked into toptag function to look at the adj.pvalue and found they are all identical and close to 1. So, this was the reason of no sig. genes retrieved. I have also tried all the P.adj methods, they gave the same results. I have calculated adj p-value manually using function (p.unadju), they gave the same results. May be because of the 2 biological replicates vs 10 replicates is reducing the sig. DE power ?
Any explanation of why do I get identical adj. p value ? although P-values are different ? Can I use P-values for sig DE genes at 0.05 ?
My code:
# Convert filtered raw counts to DGEList list
L10_dgeObj <- DGEList(L10_counts.keep)
# TMM normalization
L10_dgeObj <- calcNormFactors(L10_dgeObj)
# create design matrix to compare the two levels of Status ( Mock, infected) and adjust for time points
L10_design <- model.matrix(~Time_point+Status)
# dispersion estimation
L10_y <- estimateDisp(L10_dgeObj, L10_design)
L10_y$common.dispersion
L10_y$trended.dispersion
Tagwisedie<- L10_y$tagwise.dispersion
# instaling statmod package helps to robustness the DE model
install.packages('statmod')
library('statmod')
# fitting the linear model.Robust = TRUE
    L10_fit<- glmQLFit(L10_y, L10_design, robust = TRUE)
# running the DE test
    L10_tr <- glmQLFTest(L10_fit, coef = "StatusInfected")
# get summary of decideTest
    summary(decideTests(L10_tr))
# Get list of top sig DE gene based on adj. pvalue
    topTags(L10_tr, n = 15420, adjust.method = 'BH', sort.by = 'PValue', p.value = 0.05)
Session Info:
R version 4.2.3 (2023-03-15 ucrt)
Platform: x86_64-w64-mingw32/x64 (64-bit)
Running under: Windows 10 x64 (build 19045)

Matrix products: default

locale:
[1] LC_COLLATE=English_United Kingdom.utf8  LC_CTYPE=English_United Kingdom.utf8
[3] LC_MONETARY=English_United Kingdom.utf8 LC_NUMERIC=C
[5] LC_TIME=English_United Kingdom.utf8

attached base packages:
[1] stats     graphics  grDevices utils     datasets  methods   base

other attached packages:
 [1] vegan_2.6-4          lattice_0.21-8       permute_0.9-7        xlsx_0.6.5
 [5] statmod_1.5.0        readxl_1.4.3         BiocManager_1.30.22  edgeR_3.40.2
 [9] metagenomeSeq_1.40.0 RColorBrewer_1.1-3   glmnet_4.1-8         Matrix_1.6-0
[13] limma_3.54.2         Biobase_2.60.0       BiocGenerics_0.44.0

loaded via a namespace (and not attached):
  [1] Rtsne_0.16             colorspace_2.1-0       ellipsis_0.3.2         XVector_0.38.0
  [5] fs_1.6.3               rstudioapi_0.15.0      remotes_2.4.2.1        fansi_1.0.4
  [9] codetools_0.2-19       splines_4.2.3          cachem_1.0.8           knitr_1.44
 [13] pkgload_1.3.2.1        ade4_1.7-22            jsonlite_1.8.7         phyloseq_1.44.0
 [17] rJava_1.0-6            cluster_2.1.4          shiny_1.7.5            compiler_4.2.3
 [21] fastmap_1.1.1          cli_3.6.1              later_1.3.1            htmltools_0.5.5
 [25] prettyunits_1.1.1      tools_4.2.3            igraph_1.5.1           gtable_0.3.4
 [29] glue_1.6.2             GenomeInfoDbData_1.2.9 reshape2_1.4.4         dplyr_1.1.2
 [33] Rcpp_1.0.11            cellranger_1.1.0       vctrs_0.6.3            Biostrings_2.66.0
 [37] rhdf5filters_1.10.1    multtest_2.54.0        ape_5.7-1              nlme_3.1-162
 [41] iterators_1.0.14       xfun_0.40              stringr_1.5.0          xlsxjars_0.6.1
 [45] ps_1.7.5               mime_0.12              miniUI_0.1.1.1         lifecycle_1.0.3
 [49] gtools_3.9.4           devtools_2.4.5         zlibbioc_1.44.0        MASS_7.3-60
 [53] scales_1.2.1           promises_1.2.1         parallel_4.2.3         biomformat_1.26.0
 [57] rhdf5_2.42.1           yaml_2.3.7             memoise_2.0.1          gridExtra_2.3
 [61] ggplot2_3.4.3          stringi_1.7.12         S4Vectors_0.36.2       foreach_1.5.2
 [65] caTools_1.18.2         pkgbuild_1.4.2         shape_1.4.6            GenomeInfoDb_1.34.9
 [69] rlang_1.1.1            pkgconfig_2.0.3        matrixStats_1.0.0      bitops_1.0-7
 [73] Wrench_1.16.0          evaluate_0.21          purrr_1.0.2            Rhdf5lib_1.20.0
 [77] htmlwidgets_1.6.2      tidyselect_1.2.0       processx_3.8.2         plyr_1.8.8
 [81] magrittr_2.0.3         R6_2.5.1               IRanges_2.32.0         gplots_3.1.3
 [85] generics_0.1.3         profvis_0.3.8          pillar_1.9.0           mgcv_1.9-0
 [89] survival_3.5-5         RCurl_1.98-1.12        tibble_3.2.1           crayon_1.5.2
 [93] KernSmooth_2.23-22     utf8_1.2.3             microbiome_1.20.0      rmarkdown_2.24
 [97] urlchecker_1.0.1       usethis_2.2.2          locfit_1.5-9.8         grid_4.2.3
[101] data.table_1.14.8      callr_3.7.3            digest_0.6.33          xtable_1.8-4
[105] tidyr_1.3.0            httpuv_1.6.11          stats4_4.2.3           munsell_0.5.0
[109] sessioninfo_1.2.2


Regarding identical values of
adj.P.Val, you may want to see this post and link: Limma adj.p.value the same for many different p.valuesI went through this, but what I got is that this is normal. Does this now means I do not have any sig DE genes at 0.05 based on adj.P value ?
Thanks