
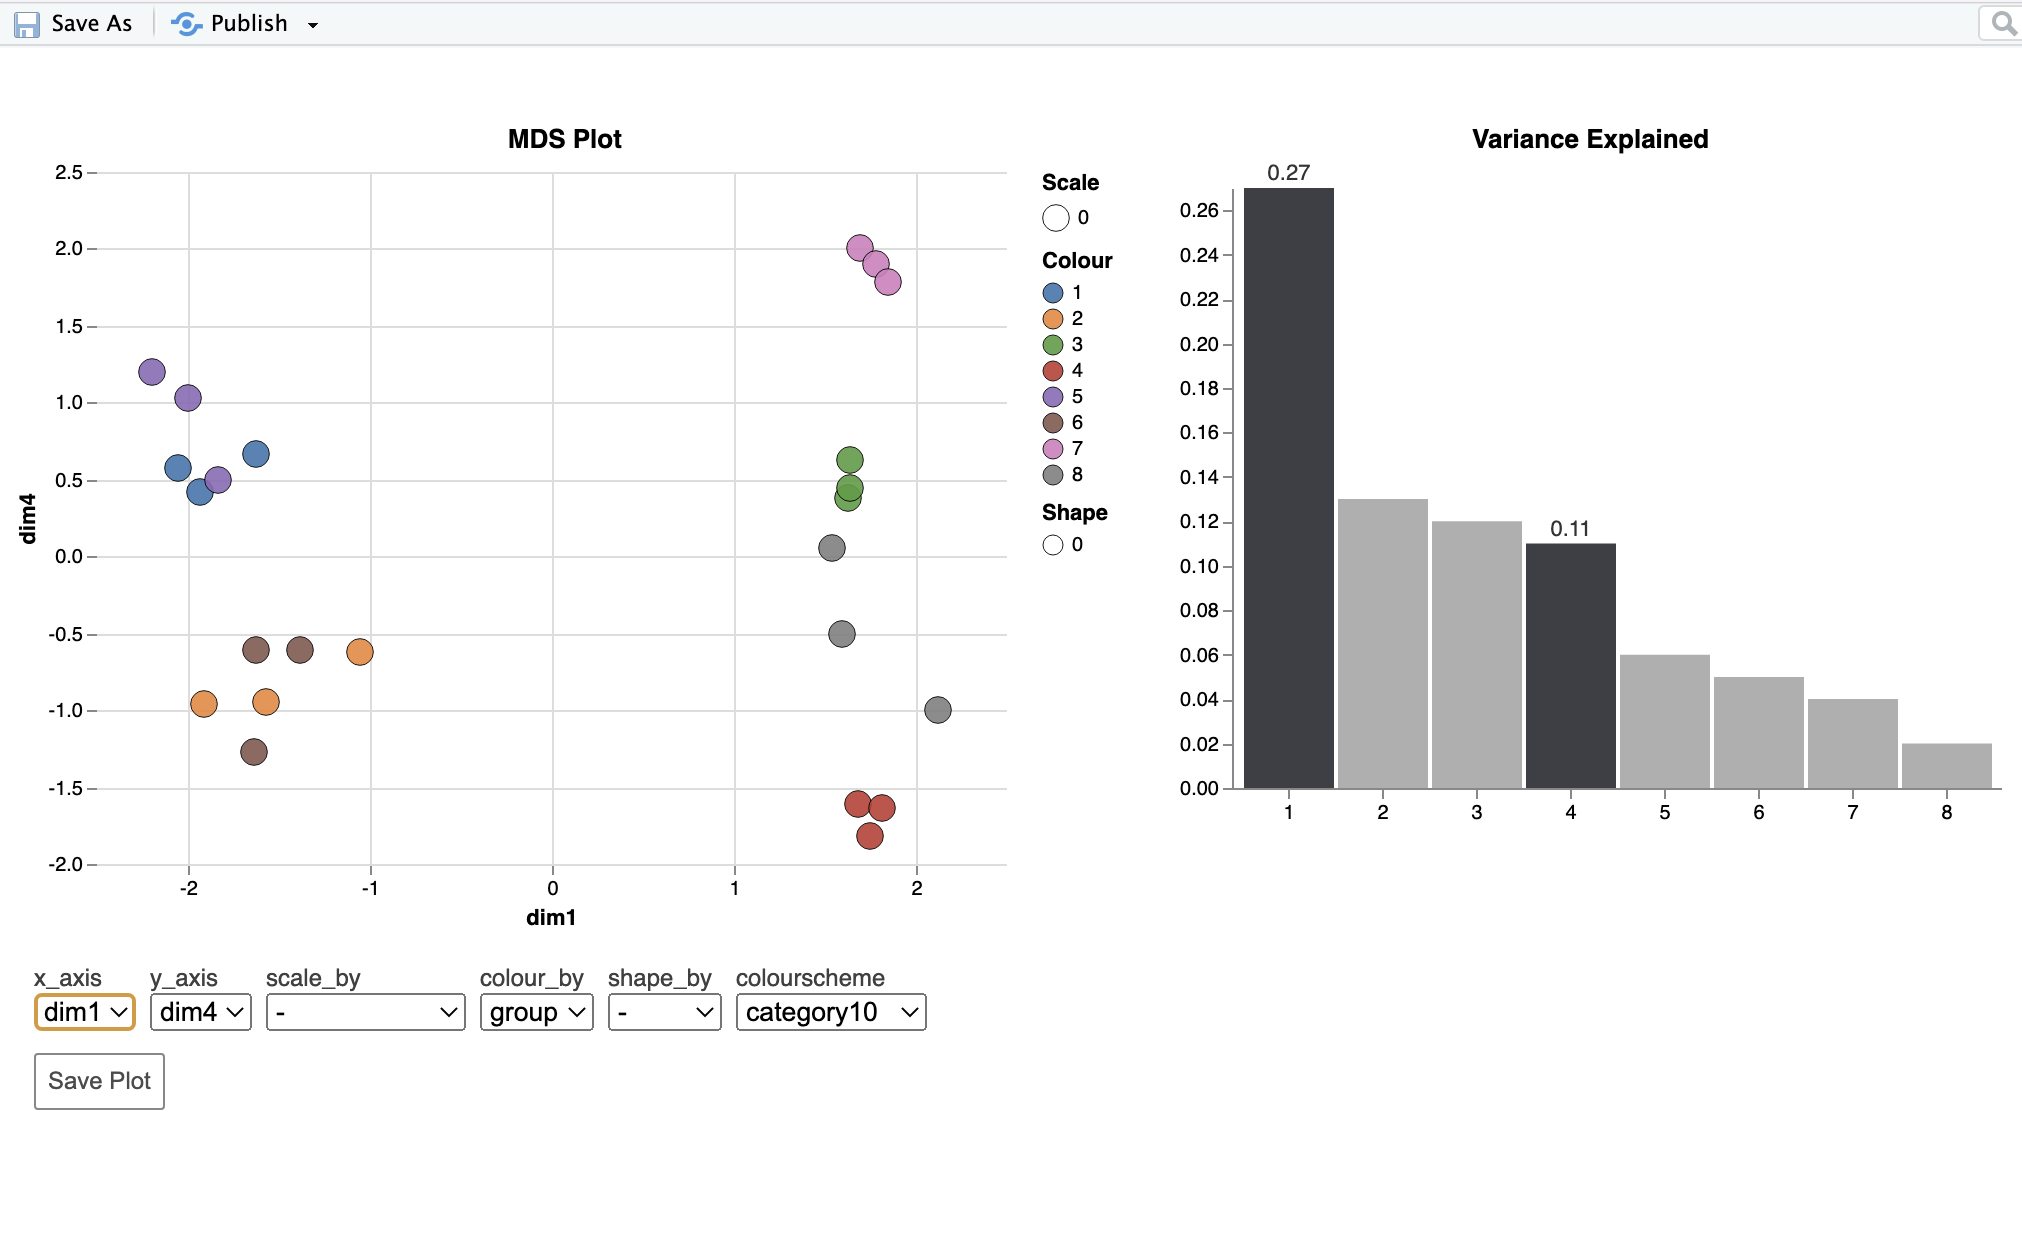
Hi, I apologize that this question may stray toward being a general statistics question, but given that it involves tests conducted in edgeR I thought it would still be appropriate to post here (please let me know if that is not the case) in case there is a mistake in my implementation of the methods. I am analyzing an RNA-seq dataset with three factors: genotype, sex, and age. I am using edgeR to identify DE genes and alternatively spliced genes. My question is about the MDS plot for the alternative splicing analysis. The first dimension very clearly separates samples by age, which explains 27% of the variation (this was similar to the mds plot for the DE anlaysis). The fourth dimension separates samples by sex, but only explains 11% of the variation. In the splicing analysis, the main effect of age identified 475 alternatively spliced genes (FDR=0.05), while the main effect of sex 3370 alternatively spliced genes. Given these results I intuitively expected sex to explain more of the variation in the mds plot than age. However, that is not the case as age (475 AS genes) explains 27% while sex (3370 AS genes) explains 11%. I assume this comes down to some combination of different effect sizes, and levels of variation between samples in each group in the statistical analysis, and the fact that the dimensions do not correspond directly to the factors in the model, but any clarification would be helpful. Mostly, I want to make sure I am not doing something wrong. I've included code below and an mds plot. Thank you!
Counts_splicing_DGE <- DGEList(counts_splicing$counts, genes=counts_splicing$annotation, group=groups)
filter_keep_splicing <- filterByExpr(Counts_splicing_DGE)
Counts_splicing_DGE_filtered <- Counts_splicing_DGE[filter_keep_splicing,]
Counts_splicing_DGE_filtered_norm_factors <- calcNormFactors(Counts_splicing_DGE_filtered)
plotMDS(Counts_splicing_DGE_filtered_norm_factors, col=colors_genotype[groups], pch=points_sex[groups])
glimmaMDS(Counts_splicing_DGE_filtered_norm_factors)
design <- model.matrix(~0+Group)
colnames(design) <- levels(Group)
Counts_splicing_DGE_filtered_norm_factors <- estimateDisp(Counts_splicing_DGE_filtered_norm_factors, design)
fit_splicing <- glmQLFit(Counts_splicing_DGE_filtered_norm_factors, design)
main_effect_contrasts=makeContrasts(Genotype_main=((Control.M.D1+Control.M.D28+Control.F.D1+Control.F.D28)-(Mutant.M.D1+Mutant.M.D28+Mutant.F.D1+Mutant.F.D28))/4,
    Age_main=((Control.M.D1+Control.F.D1+Mutant.M.D1+Mutant.F.D1)-(Control.M.D28+Control.F.D28+Mutant.M.D28+Mutant.F.D28))/4,
    Sex_main=((Control.M.D1+Control.M.D28+Mutant.M.D1+Mutant.M.D28)-(Control.F.D1+Control.F.D28+Mutant.F.D1+Mutant.F.D28))/4,
levels=design)
Genotype_main.splicing <- diffSpliceDGE(fit_splicing, geneid="GeneID", exonid="Start", contrast=main_effect_contrasts[,"Genotype_main"])
Genotype_main.splicing.results=topSpliceDGE(Genotype_main.splicing, test="Simes", n=Inf, FDR=1)
write.csv(Genotype_main.splicing.results, file="Genotype_main.splicing.results.csv")
Age_main.splicing <- diffSpliceDGE(fit_splicing, geneid="GeneID", exonid="Start", contrast=main_effect_contrasts[,"Age_main"])
Age_main.splicing.results=topSpliceDGE(Age_main.splicing, test="Simes", n=Inf, FDR=1)
write.csv(Age_main.splicing.results, file="Age_main.splicing.results.csv")
Sex_main.splicing <- diffSpliceDGE(fit_splicing, geneid="GeneID", exonid="Start", contrast=main_effect_contrasts[,"Sex_main"])
Sex_main.splicing.results=topSpliceDGE(Sex_main.splicing, test="Simes", n=Inf, FDR=1)
write.csv(Sex_main.splicing.results, file="Sex_main.splicing.results.csv")

 sessionInfo()
R version 4.2.3 (2023-03-15)
Platform: x86_64-apple-darwin17.0 (64-bit)
Running under: macOS Monterey 12.6.3

Matrix products: default
LAPACK: /Library/Frameworks/R.framework/Versions/4.2/Resources/lib/libRlapack.dylib

locale:
[1] en_US.UTF-8/en_US.UTF-8/en_US.UTF-8/C/en_US.UTF-8/en_US.UTF-8

attached base packages:
[1] stats4    stats     graphics  grDevices utils     datasets  methods   base

other attached packages:
 [1] Glimma_2.8.0                 BiocManager_1.30.22          ggpubr_0.6.0                 tidyr_1.3.0
 [5] IsoformSwitchAnalyzeR_1.20.0 ggplot2_3.4.3                DEXSeq_1.44.0                RColorBrewer_1.1-3
 [9] AnnotationDbi_1.60.2         DESeq2_1.38.3                SummarizedExperiment_1.28.0  GenomicRanges_1.50.2
[13] GenomeInfoDb_1.34.9          IRanges_2.32.0               S4Vectors_0.36.2             MatrixGenerics_1.10.0
[17] matrixStats_1.0.0            Biobase_2.58.0               BiocGenerics_0.44.0          BiocParallel_1.32.6
[21] edgeR_3.40.2                 limma_3.54.2

loaded via a namespace (and not attached):
  [1] colorspace_2.1-0              ggsignif_0.6.4                rjson_0.2.21                  hwriter_1.3.2.1
  [5] ellipsis_0.3.2                futile.logger_1.4.3           XVector_0.38.0                bit64_4.0.5
  [9] interactiveDisplayBase_1.36.0 fansi_1.0.4                   xml2_1.3.5                    codetools_0.2-19
 [13] splines_4.2.3                 tximport_1.26.1               cachem_1.0.8                  geneplotter_1.76.0
 [17] jsonlite_1.8.7                Rsamtools_2.14.0              broom_1.0.5                   annotate_1.76.0
 [21] dbplyr_2.3.3                  png_0.1-8                     shiny_1.7.5                   readr_2.1.4
 [25] compiler_4.2.3                httr_1.4.7                    backports_1.4.1               lazyeval_0.2.2
 [29] Matrix_1.5-4.1                fastmap_1.1.1                 cli_3.6.1                     later_1.3.1
 [33] formatR_1.14                  htmltools_0.5.6               prettyunits_1.1.1             tools_4.2.3
 [37] gtable_0.3.4                  glue_1.6.2                    GenomeInfoDbData_1.2.9        reshape2_1.4.4
 [41] dplyr_1.1.3                   rappdirs_0.3.3                Rcpp_1.0.11                   carData_3.0-5
 [45] DRIMSeq_1.26.0                vctrs_0.6.3                   Biostrings_2.66.0             rtracklayer_1.58.0
 [49] stringr_1.5.0                 mime_0.12                     lifecycle_1.0.3               ensembldb_2.22.0
 [53] restfulr_0.0.15               rstatix_0.7.2                 statmod_1.5.0                 XML_3.99-0.14
 [57] AnnotationHub_3.6.0           zlibbioc_1.44.0               scales_1.2.1                  BSgenome_1.66.3
 [61] ProtGenerics_1.30.0           hms_1.1.3                     promises_1.2.1                parallel_4.2.3
 [65] AnnotationFilter_1.22.0       lambda.r_1.2.4                yaml_2.3.7                    curl_5.0.2
 [69] memoise_2.0.1                 gridExtra_2.3                 biomaRt_2.54.1                stringi_1.7.12
 [73] RSQLite_2.3.1                 BiocVersion_3.16.0            genefilter_1.80.3             BiocIO_1.8.0
 [77] GenomicFeatures_1.50.4        filelock_1.0.2                rlang_1.1.1                   pkgconfig_2.0.3
 [81] bitops_1.0-7                  lattice_0.21-8                purrr_1.0.2                   htmlwidgets_1.6.2
 [85] GenomicAlignments_1.34.1      bit_4.0.5                     tidyselect_1.2.0              plyr_1.8.8
 [89] magrittr_2.0.3                R6_2.5.1                      generics_0.1.3                DelayedArray_0.24.0
 [93] DBI_1.1.3                     pillar_1.9.0                  withr_2.5.0                   abind_1.4-5
 [97] survival_3.5-7                KEGGREST_1.38.0               RCurl_1.98-1.12               tibble_3.2.1
[101] tximeta_1.16.1                car_3.1-2                     crayon_1.5.2                  futile.options_1.0.1
[105] utf8_1.2.3                    BiocFileCache_2.6.1           tzdb_0.4.0                    progress_1.2.2
[109] locfit_1.5-9.8                grid_4.2.3                    blob_1.2.4                    digest_0.6.33
[113] xtable_1.8-4                  VennDiagram_1.7.3             httpuv_1.6.11                 munsell_0.5.0
>


To add another possible explanation: is this just happening because, at this stage in the analysis pipeline, it is looking across all exons and essentially just picking up the gene-level differences? If that is the case, then I guess it doesn't make sense to make separate mds plot on the splicing data (at least for the purpose I outlined above)?