
Hi, Following up from my previous question,
I have an RNASeq experiment with control and cohort/diseased samples, whereas the cohort samples can be lesional or non-lesional, and can have a unique phenotype/characteristic. I ran the experiment with grouping (below, what was "approach #1" in my previous question).
pData %>% mutate(grp = paste0(Src, "_", Pheno)) %>% (... converting to a factor ...) # will create the groups: NL_N, LS_N, NL_Y, LS_Y
design<-model.matrix("~0 + grp + age + sex", data=DGE.cpm$samples) # the design table will have columns as groups above, plus age and sex columns.
contrasts_table = makeContrasts(
     LS_B.vs.NL_B = (grpLS_Y + grpLS_N) / 2 - (grpNL_Y + grpNL_N) / 2,
     LS_Y.vs.NL_Y = grpLS_Y - grpNL_Y,
     LS_N.vs.NL_N = grpLS_N - grpNL_N,
     LS_Y.vs.LS_N = grpLS_Y - grpLS_N,
     NL_Y.vs.NL_N = grpNL_Y - grpNL_N,
)
Running the voomWithQualityWeights-duplicatecorrelation-limma pipeline produced very weird results in the NL_Y.vs.NL_N with a staggering amount of DEGs (up 1829 | nondiff 6711 | down 2374). The problem was that I didn't include +batch to my model matrix formula, and there was one sample from a 2nd batch with a technical replicate from the 1st batch. The reason I have this sample to begin with is to help me do future batch correction, as explained here.
While removing the sample, combining the technical replicates via sumTechReps or fixing the formula to be "~0 + grp + age + sex + batch" addressed the issue, it occurred to me that a single sample caused this huge impact.
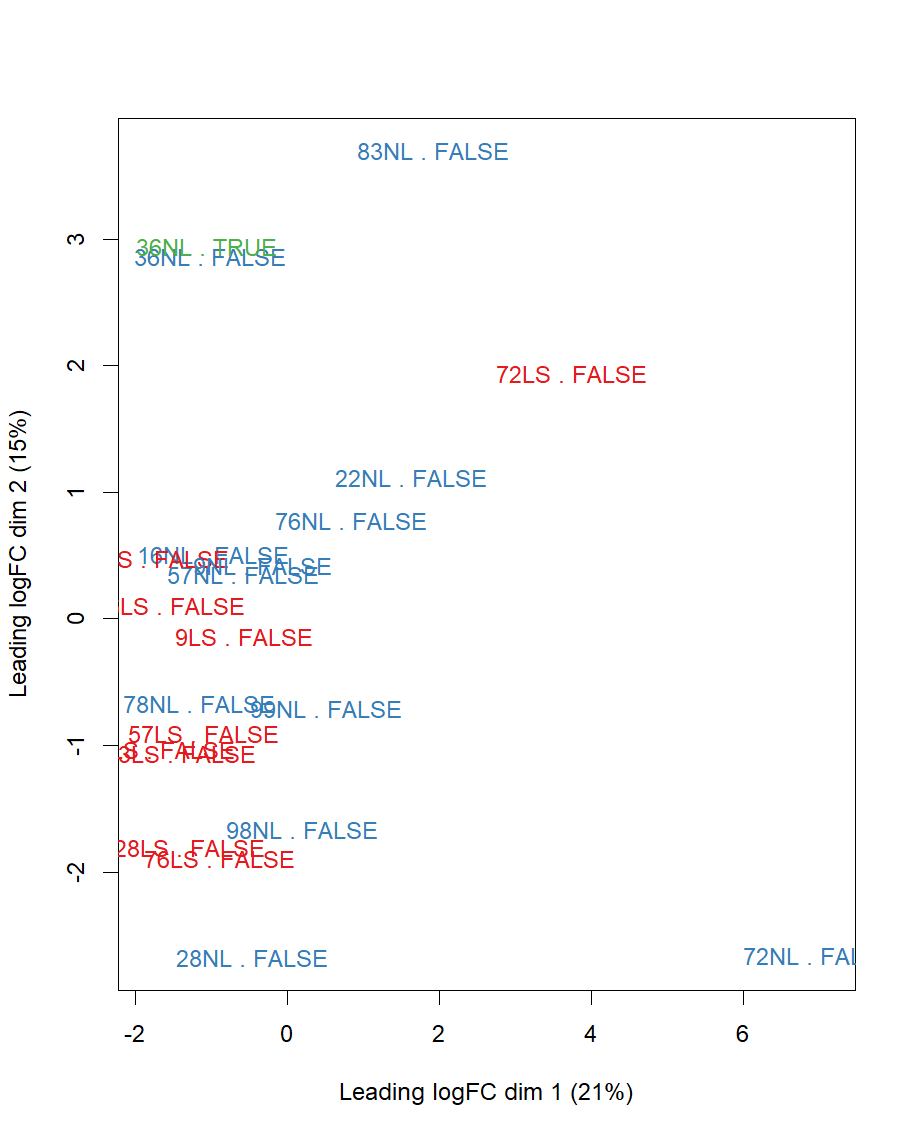
I was wondering how this could be; Even though voom was executed with quality weights, and even though the MDS / PCA (below) plots showed that the two technical replicates are very similar, removing this single sample / including +batch
in my formula had such an impact on this study.
Any ideas on how a single sample affects the analysis that much, or how to test what is so unique about this sample?
MDS PLOT (label is PatientID.Type.Batch), note the top-left technical replicates of sample #36:
Happy to hear your thoughts!