
Hello!
We are looking at extra cellular RNA which has been collected from cell culture media. We used UMIs to tag and sequence nucleotides which were present in the media, processed them with nf-core RNA-seq pipeline and generated counts using subreads. Due to the nature of data, we are not sure if we can expect any consistent expression across/within sample groups. For now we have just followed the basic documentation of DESeq2. We used plotDispEsts which can indicate if the data works well with DESeq2 or not. The plot looks like this -
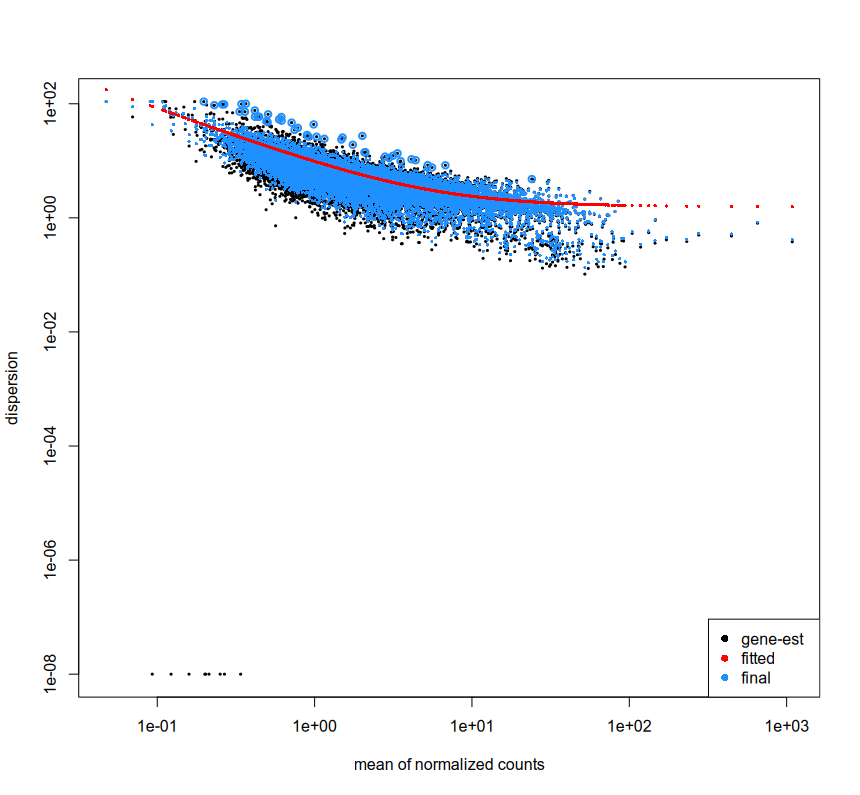
From what I understand, this indicates that DESeq2 can work for the data, however why are there some gene-est which are at the lower left corner? Is it because they have too little reads? I have filtered the data as mentioned in the documentation.
Also, the plotMA for res and resLFC seem to have very few blue points (i.e. significant fold change right?). How can I interpret this? That there are very few log fold changes with high significance?
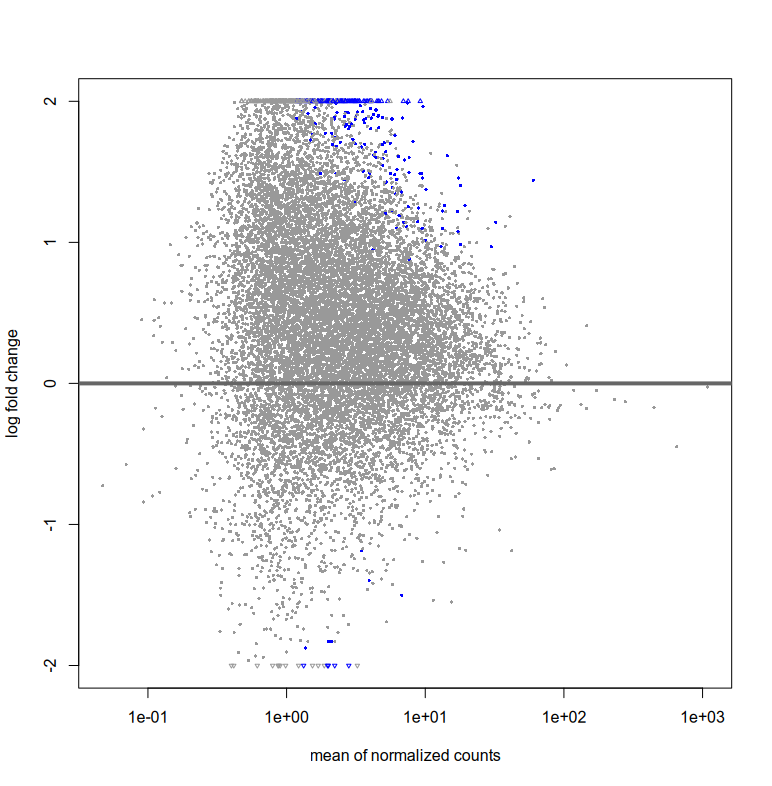
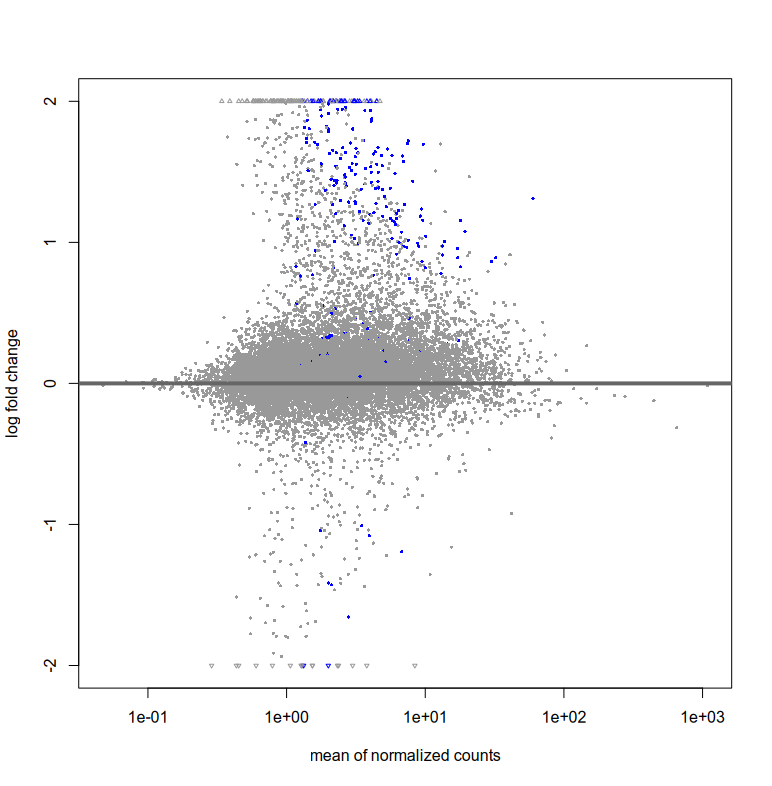

So in essence, we can use DESeq2 to compare the groups in the cohort, right? Due to the potential dispersed nature of reads (As it is exRNA), I was thinking if using gene wise counts would be more accurate. Right now the plots were generated using exon level counts (Generated from featureCounts).