
Hello, I am trying to fit natural splines to my data, and I have a question of controling for covariaten. For splines or polynomials I have to treat age as a continuous variable, does the algorithm then assigns groups to my replicate ages; or does it treat all data as one group? How would correction work in that case? I can group the young Wildtype together with the 4.8 y.o.; is that necessary to increase power or again, groups don't matter with age as continous?
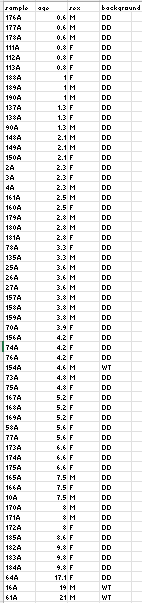
I have a pretty unbalanced design as the wildtype animals were unique and irreplacable, but they group together on PCA so I have to control for genetic background.
When I try this code DESEq2 doesn't complain, but I still want to be sure.
dds <- DESeqDataSetFromMatrix(countData = counts,
                                  colData = coldata,
                                  design = ~ ns(age_scaled, df = 3) + background)

keep <- rowSums(counts(dds) >= 10) >= 3
dds <- dds[keep,]


dds <- DESeq(dds, test="LRT", reduced = ~ background)
res <- results(dds)
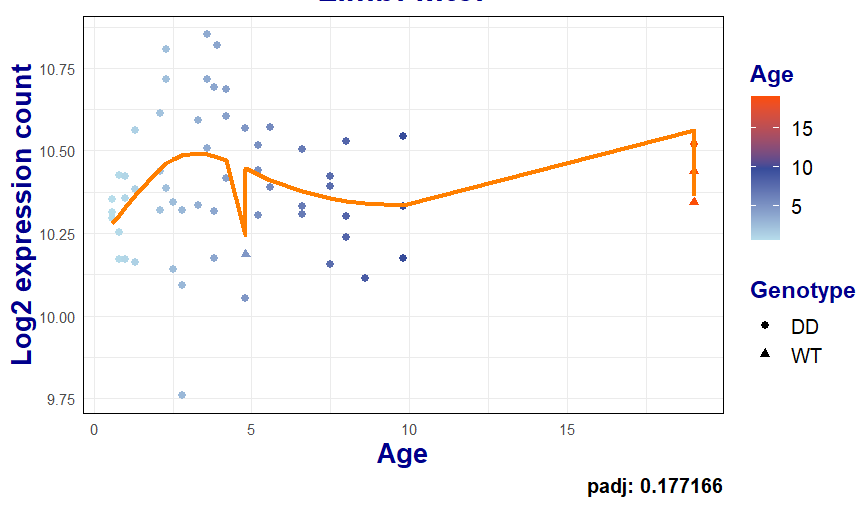
If I am indeed doing it correctly a follow-up question is then about plotting the fitted models, as it introduces these "jumps" in the coordinates and I cannot do a simple geom_line (code shortened):
coef_mat <- coef(dds)
design_mat <- model.matrix(design(dds), colData(dds))

dat <- plotCounts(dds, gene, intgroup = c("age", "sex", "genotype"), returnData = TRUE) %>%
    mutate(logmu = design_mat %*% coef_mat[gene,],
           logcount = log2(count + 1))

ggplot(dat, aes(age, logcount)) +
    geom_point(aes(color = age, shape = genotype), size = 2) +
    geom_line(aes(age, logmu), col="#FF7F00", linewidth = 1.2) +
    labs(
      title = paste(, gene),
      x = "Age",
      y = "Log2 expression count",
      color = "Age",
      shape = "Genotype",
      caption = paste("padj:", formatted_padj)
    )
I could do geom_smooth, but while that would look good it techically wouldn't directly reflect the fitted model anymore. Thanks a lot in advance.
