
Hello, I am fitting splines in DESeq2 like so:
dds <- DESeqDataSetFromMatrix(countData = counts,
                                  colData = coldata,
                                  design = ~ ns(age_scaled, df = 3))
Plotting later using the code Mike Love posted elsewhere:
dat <- plotCounts(dds, gene, intgroup = c("age", "sex", "genotype"), returnData = TRUE) %>%
    mutate(logmu = design_mat %*% coef_mat[gene,],
           logcount = log2(count + 1))

ggplot(dat, aes(age, logcount)) +
    geom_point(aes(color = age, shape = genotype), size = 2) +
    geom_line(aes(age, logmu), col="#FF7F00", linewidth = 1.2) +
    labs(
      title = gene,
      x = "Age",
      y = "Log2 expression count",
      color = "Age"
    )
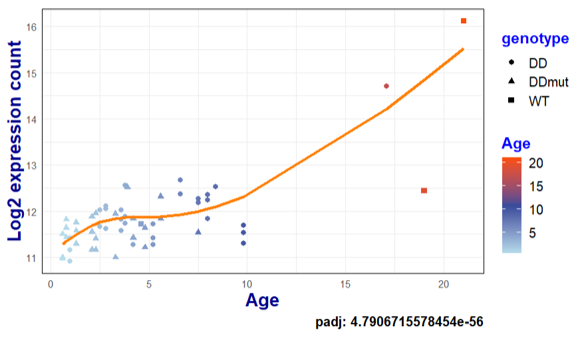
You can see I have a large gap in the data, and currently I am plotting a geom_line through the predicted values, only for the ages that I have in coldata. I am wondering if one can somehow extract the model itself to make predictions for the ages that aren't present in my coldata, so that I can visualize the predicted values per age (say, every year). I know you can do this with linear models with predict() by extracting the coef(dds), but can that be done for non-linear models?
sessionInfo( ) R version 4.3.1 (2023-06-16 ucrt) Platform: x86_64-w64-mingw32/x64 (64-bit) Running under: Windows 11 x64 (build 22621)
Matrix products: default
locale:
1 LC_COLLATE=English_United States.utf8 LC_CTYPE=English_United States.utf8
[3] LC_MONETARY=English_United States.utf8 LC_NUMERIC=C
[5] LC_TIME=English_United States.utf8
time zone: Europe/Berlin tzcode source: internal
attached base packages: 1 splines stats4 stats graphics grDevices utils datasets methods base
other attached packages:
1 limma_3.56.2 ReactomePA_1.44.0 DOSE_3.26.2
[4] enrichplot_1.20.3 clusterProfiler_4.8.3 shiny_1.7.5.1
[7] xlsx_0.6.5 readxl_1.4.3 EnhancedVolcano_1.18.0
[10] ggrepel_0.9.3 RColorBrewer_1.1-3 pheatmap_1.0.12
[13] DESeq2_1.40.2 SummarizedExperiment_1.30.2 Biobase_2.60.0
[16] MatrixGenerics_1.12.3 matrixStats_1.0.0 GenomicRanges_1.52.0
[19] GenomeInfoDb_1.36.4 IRanges_2.34.1 S4Vectors_0.38.1
[22] BiocGenerics_0.46.0 lubridate_1.9.3 forcats_1.0.0
[25] stringr_1.5.0 dplyr_1.1.2 purrr_1.0.2
[28] readr_2.1.4 tidyr_1.3.0 tibble_3.2.1
[31] ggplot2_3.4.4 tidyverse_2.0.0 BiocManager_1.30.22
```

That worked, thanks a lot!