Entering edit mode

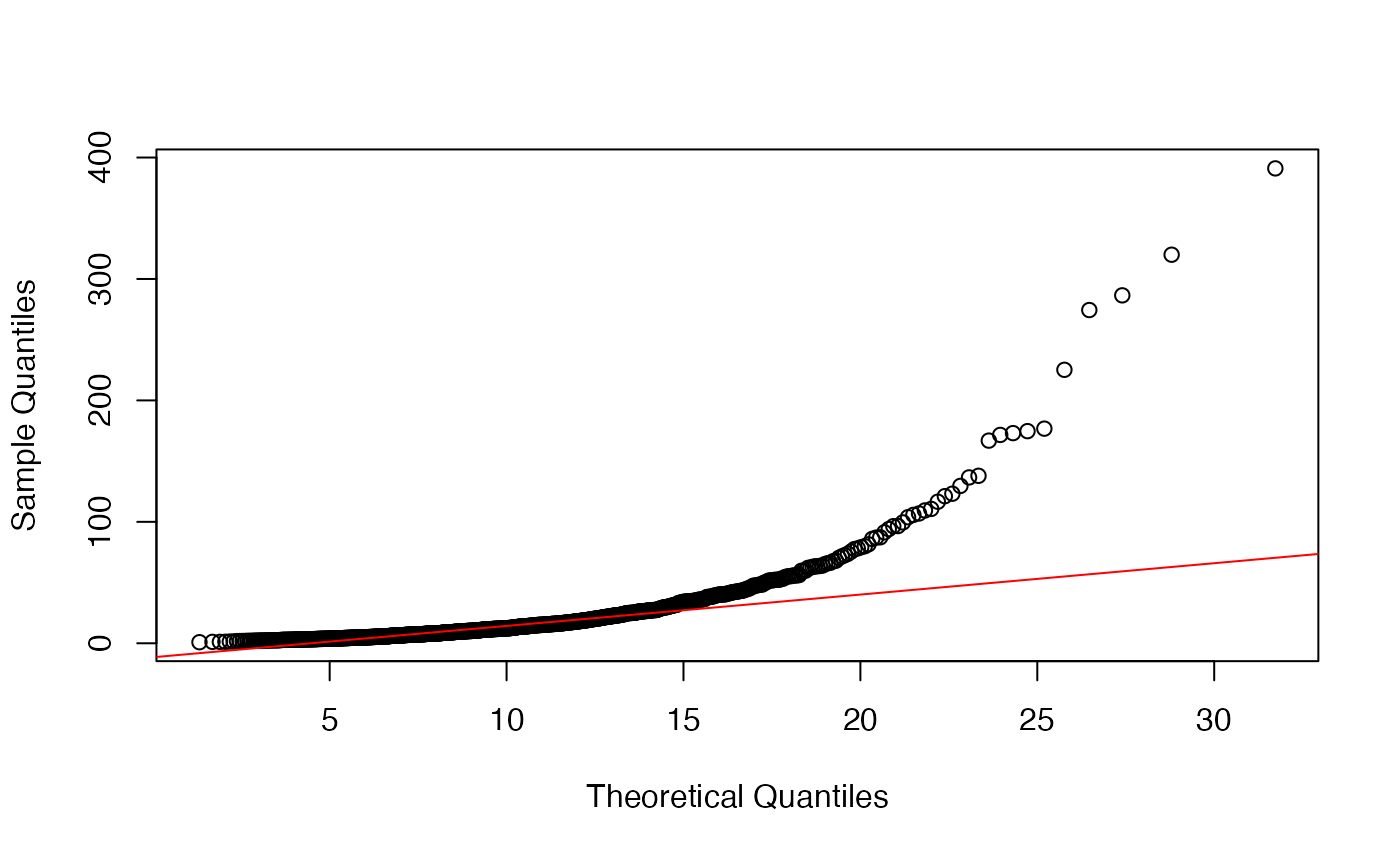
Since limma is also applied to data types other than microarrays, e.g. MS-based proteomics data, is it advisable to asses the fit of the variance prior before running limma? I found that even for data that follows the limma model, it is difficult to judge the fit of the prior based on a QQ-plot. In the example below, the fit does not seem to be very good although the estimates of df.prior and s2.prior are very close to the true value.
library("limma")

plot_prior_fit <- function(fit){

  q_chisq <- function(p) {qchisq(p, df = fit$df.prior)}

  y <- fit$df.prior*fit$s2.prior/fit$sigma^2

  qqplot(
    x = q_chisq(ppoints(y)),
    y = y,
    xlab = "Theoretical Quantiles", ylab = "Sample Quantiles"
  )
  qqline(y, distribution = q_chisq, col = "red")
}

n_genes <- 5000
n_samples_per_group <- 4

set.seed(1)
sigma2 <- 0.05 / rchisq(n_genes, df = 10) * 10
y <- matrix(rnorm(n_genes*2*n_samples_per_group, sd = sqrt(sigma2)), nrow = n_genes, ncol = 2*n_samples_per_group)
design <- cbind(Intercept = 1, Group = c(rep(0, n_samples_per_group), rep(1, n_samples_per_group)))
# 1% of genes differentially expressed
y[seq_len(floor(n_genes/100)), seq_len(n_samples_per_group)] <- y[seq_len(floor(n_genes/100)), seq_len(n_samples_per_group)] + 1
fit <- lmFit(y,design)
fit <- eBayes(fit)

plot_prior_fit(fit)