Entering edit mode

Hi All,
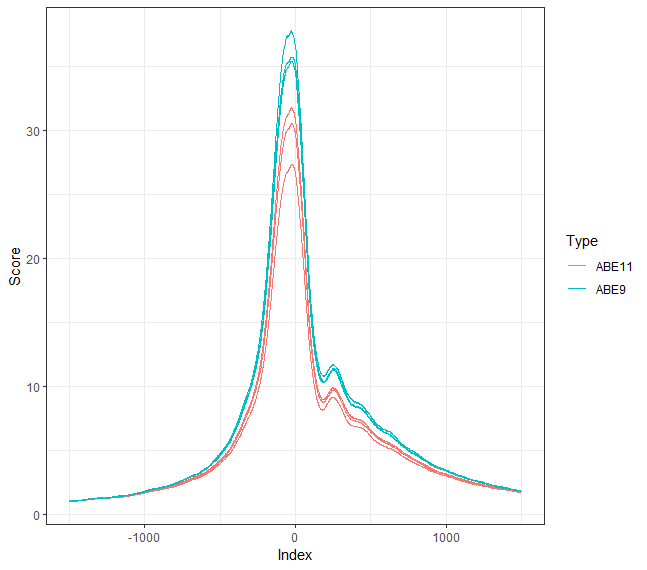
I`m using diffBind to analyze my ATACseq results. I have 2 groups (before and after treatment) in triplicates. How can I create a plot of Score around TSS using the data from dba.obj$peaks? I get a data frame of "seqnames" "start" "end" "Score" "RPKM" "Reads" "cRPKM" "cReads" per sample.
Currently I used soGGi package (attached), but I wish to use the data from the diffBind dba.obj and compare it to soGGi.
Thank you !
nucFree <- regionPlot(bamFile = files[[3]], testRanges = TSSs, style = "point",
              format = "bam", paired = TRUE, minFragmentLength = 0, maxFragmentLength = 100,
              forceFragment = 50,normalize = "RPM")