filtering lowly expressed reads
1
0
Entering edit mode
@14ef1b09
Last seen 1 day ago
Egypt

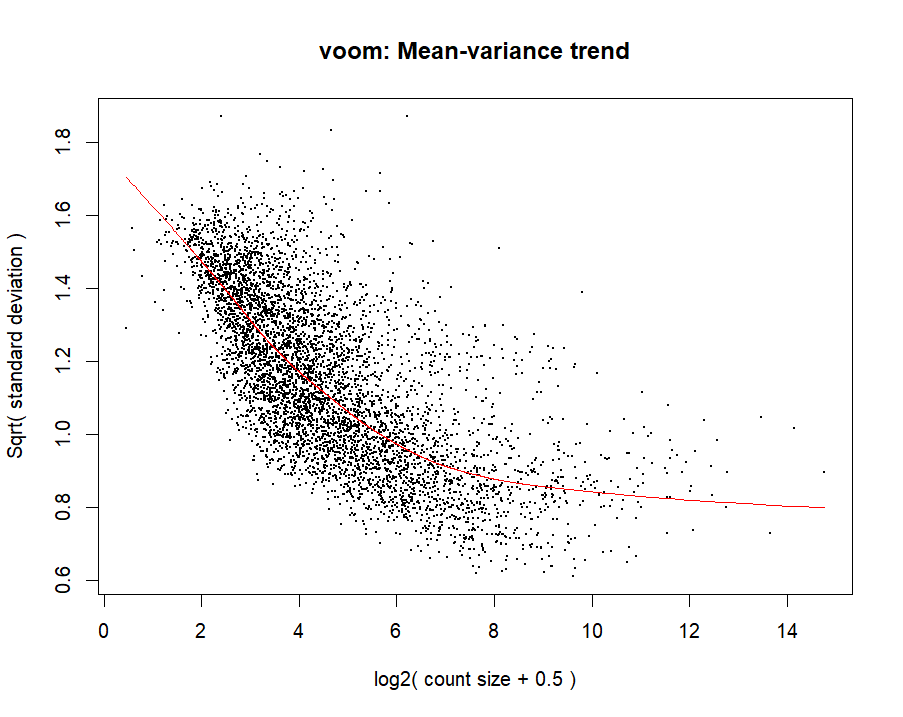
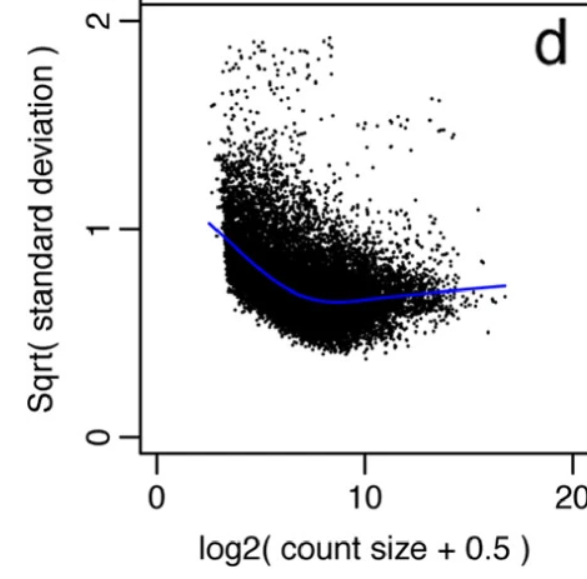
How do I ensure that filtration of lowly expressed counts in RNA seq data was done correctly? my goal is to find DEGs using limma voom This is a plot of data before and after filtering by filterbyExpr ?

Code should be placed in three backticks as shown below

cpm <- cpm(dge)
lcpm <- cpm(dge, log=TRUE)
L <- mean(dge$samples$lib.size) * 1e-6
M <- median(dge$samples$lib.size) * 1e-6
c(L, M)
lcpm.cutoff <- log2(10/M + 2/L)
library(RColorBrewer)
nsamples <- ncol(dge$counts)
col <- brewer.spectral(nsamples)
par(mfrow=c(1,2))
plot(density(lcpm[,1]), col=col[1], lwd=2, ylim=c(0,0.55), las=2, main="", xlab="")
title(main="A. Raw data", xlab="Log-cpm")
abline(v=lcpm.cutoff, lty=3)
for (i in 2:nsamples){
  den <- density(lcpm[,i])
  lines(den$x, den$y, col=col[i], lwd=2)
}

##FilterbyExpr

keep.exprs <- filterByExpr(dge, group = dge$samples$group)
dge <- dge[keep.exprs,, keep.lib.sizes=FALSE]
dim(dge)

lcpm <- cpm(dge, log=TRUE)
plot(density(lcpm[,1]), col=col[1], lwd=2, ylim=c(0,0.5), las=2, main="", xlab="")
title(main="B. Filtered data", xlab="Log-cpm")
abline(v=lcpm.cutoff, lty=3)
for (i in 2:nsamples){
  den <- density(lcpm[,i])
  lines(den$x, den$y, col=col[i], lwd=2)
}
RNASeq limma DifferentialExpression Preprocessing • 562 views
ADD COMMENT
0
Entering edit mode

This is a plot of data before and after filtering by filterbyExpr

ADD REPLY
0
Entering edit mode

Cross-posted to Biostars https://www.biostars.org/p/9584889/

ADD REPLY
2
Entering edit mode
@gordon-smyth
Last seen 2 hours ago
WEHI, Melbourne, Australia

Filtering is discussed in the limma documentation and workflow examples. As has been discussed previously on this forum, the success of the filtering can be seen in the voom plot.

Making a density plot of log-cpm values does not assess the filtering. limma does not make any assumptions about the shape of the log-cpm histogram.

ADD COMMENT
0
Entering edit mode

Thanks for clarifying. I already created the voom plot 1 but I am not sure if it reflects biological variability. Can you give more insights about this and how plot 1 is different from plot 2 ?

voom plot 1

voom plot 2

ADD REPLY
2
Entering edit mode

I don't know what more I can add to the documentaiton and published papers already provided. limma seems to be working perfectly for you. Your voom plot seems perfect, exactly as the published paper tells you it should be like.

ADD REPLY
0
Entering edit mode

Thank you so much :D. I just needed extra confirmation.

ADD REPLY

Login before adding your answer.

Traffic: 683 users visited in the last hour
Help About
FAQ
Access RSS
API
Stats

Use of this site constitutes acceptance of our User Agreement and Privacy Policy.

Powered by the version 2.3.6