Entering edit mode
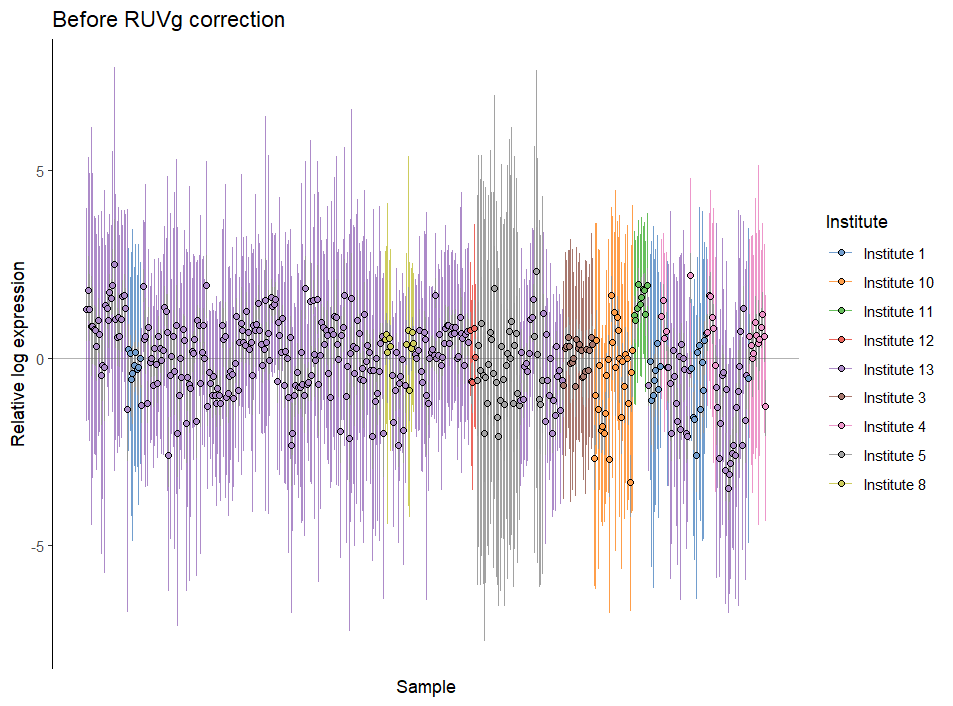
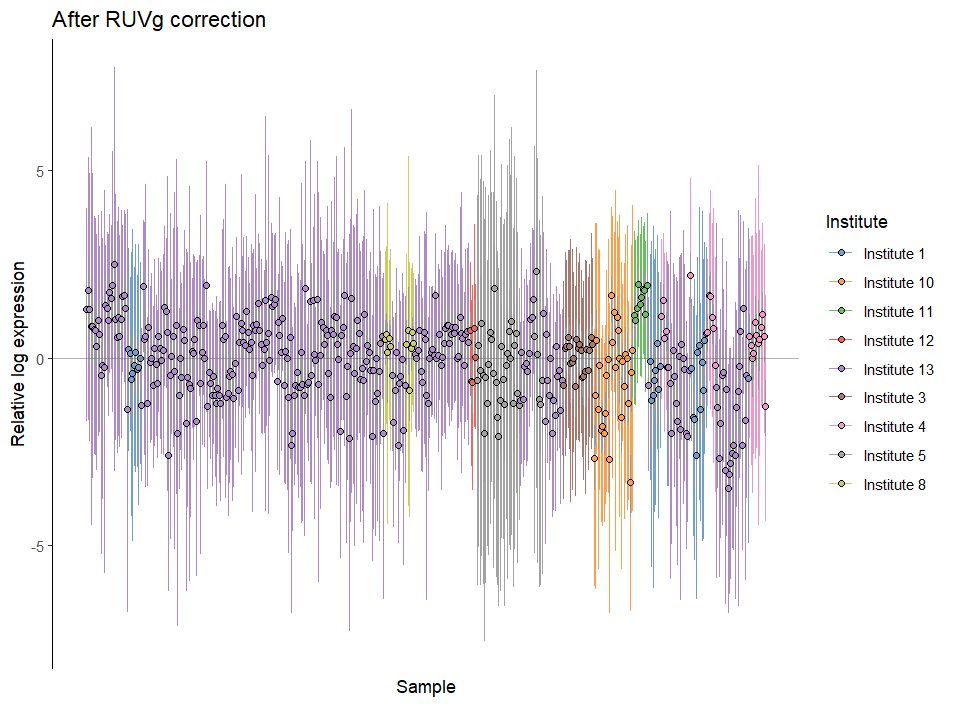
I performed RUVg correction but plotting RLE plots show that the data hasn't been corrected. They look the same. I wonder what might be causing this issue. I have applied the same steps with some other samples and the RLE plots did show that the unwanted variation was removed.

sce1 <- SingleCellExperiment(assays = list(counts =raw_counts))
colData(sce1)$Institute=sampleInfo$institute
colData(sce1)
plotRLE(sce1, exprs_values = "counts",
        exprs_logged=FALSE, color_by = colData(sce1),
        style = "minimal")+ggtitle("Before RUVg correction")

##RUVg correction

sce2 <- SingleCellExperiment(assays = list(counts =ruv_counts))
colData(sce2)$Institute=sampleInfo$institute
colData(sce2)
plotRLE(sce2, exprs_values = "counts", exprs_logged=FALSE, color_by = colData(sce2))+
  ggtitle("After RUVg correction")


