
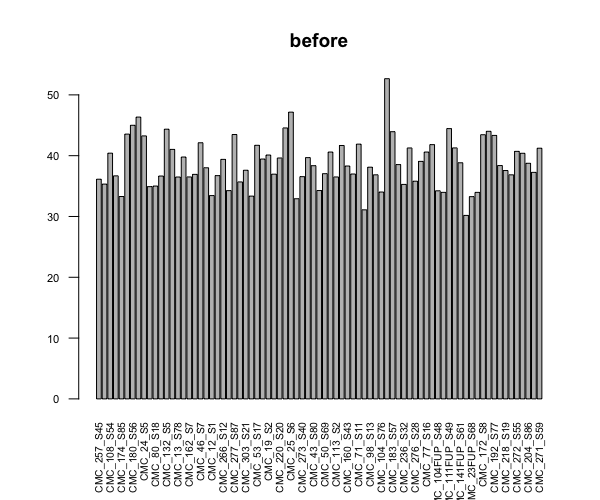
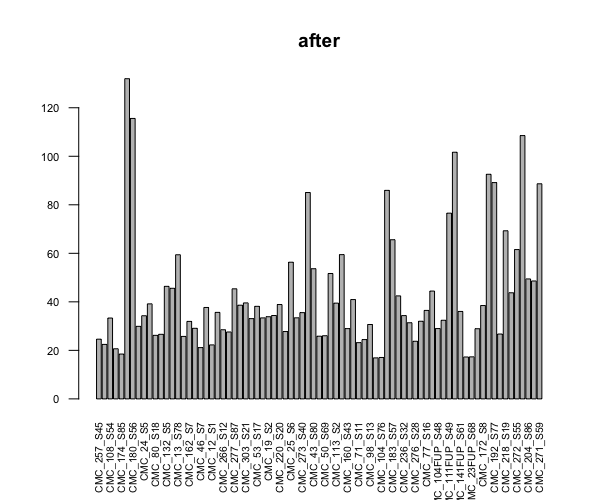
This is more like a sanity check question for experienced users, because I don't have a lot of experience on differentially expressed genes analysis. I am trying to perform DEGA for a large experiment with 80 samples in 10 conditions (not 8x10 unfortunately but each condition has a random sample size, min=2). I started with sample QCs, and just out of curiosity checked the library sizes before and after I run dds. I know DESeq2 does normalization not only based on the library size, so I don't expect them to be equal, but the difference seemed too extreme to me.
Do you think I'm doing something wrong or do I need to do any other filtering? Or maybe this is normal when it comes to experiments with too many samples and conditions? What might be causing library sizes to change this much?
I'd appreciate it if you share any insight.
Thank you!
barplot(colSums(countDataOnly)/1e6, las=2, cex.axis=0.7, cex.names=0.65, main = "before") # before

dds <- DESeqDataSetFromMatrix(countData = countDataOnly, colData = colData, design = ~batch+condition)
dds <- DESeq(dds)

barplot(colSums(counts(dds, normalized=TRUE))/1e6, las=2, cex.axis=0.7, cex.names=0.65, main = "after")

Thank you for the answer Michael. I appreciate the scatter plot suggestion as it already brought me some insight and relief :)
I did two different trials of scatter plot comparison between 2 samples, both similar lib size at the beginning (~40M), one stays same, one becomes >100M after dds. I did the plot both before and after dds. In both cases genes that were highly different between the two were hemoglobin genes (I think researchers who own the data told me that these were blood samples, so those are expected), but in both cases the sample that stayed the same had higher counts for almost all genes.
I'm attaching zoomed in plots for one of these comparisons, both before and after. Without xlim ylim, there are only three genes that differ highly between the two at the high end (~10M in stable vs 20M in changing) and are all Hgb subunit genes. Also the ones at the bottom (high in 128 only - highly changing sample) are also Hgb subunits.
So, I guess DESeq does it correctly, and I can continue with the data as is to the DE steps. Still, I will suggest to the researchers to repeat the analysis after removing Hgb genes if those aren't of interest. Do you have any other concerns/suggestions?
I agree that you've found the issue here.
I would approach it this way. And maybe they can figure out how to minimize this variation before sequencing, as it's a lot of wasted sequence if its nuisance.