I am currently running data analysis on QuantSeq data in Atlantic salmon.
I initially worked with part of this data in 2022, and having sequenced more samples in the meantime, I reanalyzed everything. The issue I ran into while doing Over Representation Analysis is that I do not get the same results as in 2022.
Now, in 2022, the reference genome assembly was ICSASG_v2, while in 2024, the reference is Ssal_v3.1.
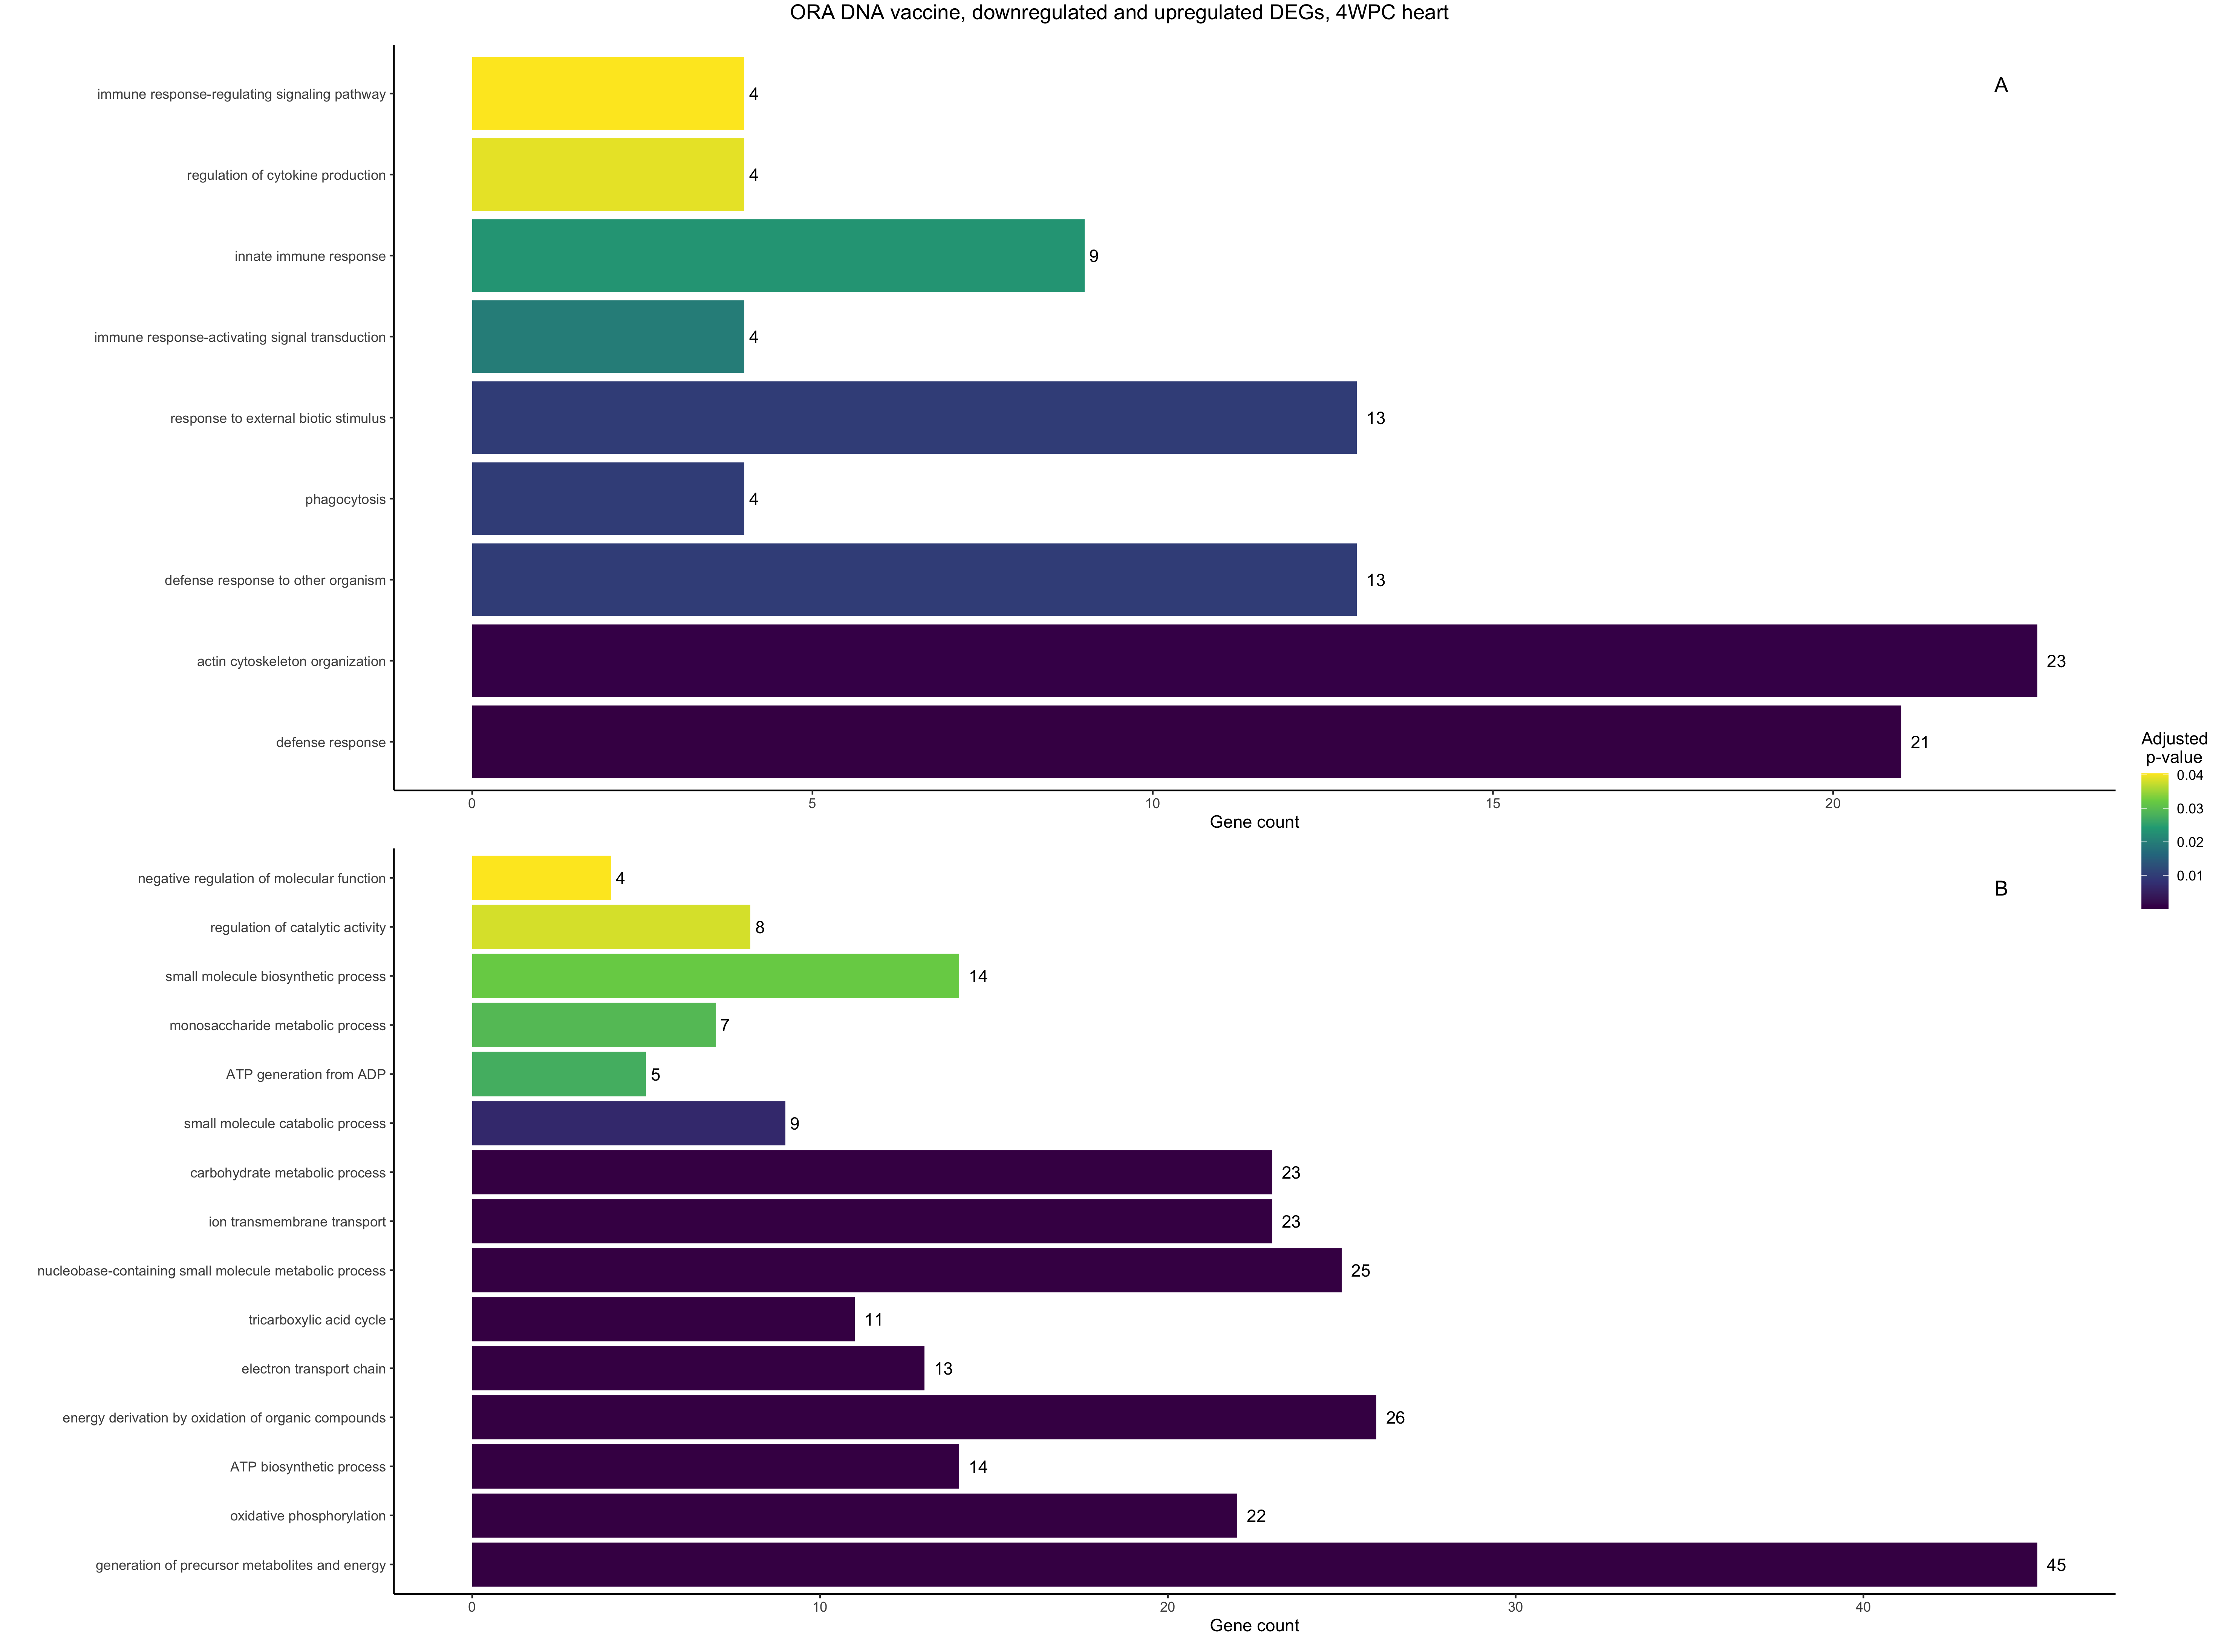
I used clusterProfiler to perform ORA in R, and I used AnnotationHub to fetch Atlantic salmon's most recent annotation file at the time (AH107424) and, as an example, I obtained this plot, comparing downregulated (A) vs upregulated (B) GO Terms:
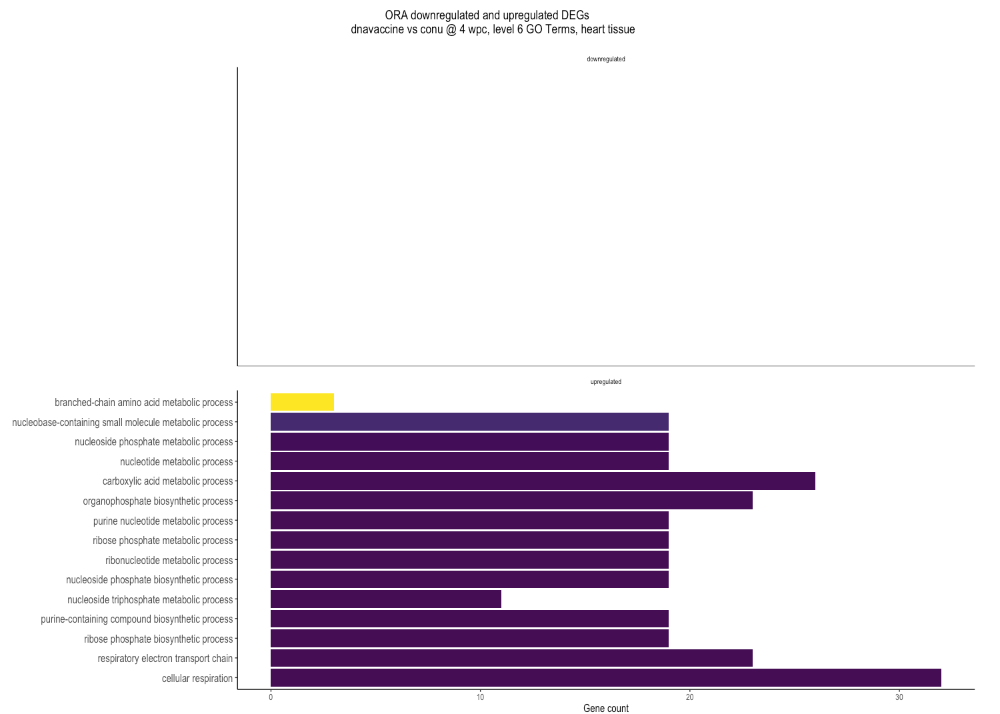
While re-analyzing the (same) data this year, the annotation file on AnnotationHub was updated (AH114250), and I get a different plot:
The point of the post is if this sort of discrepancy is normal and, if it is, how do you control for it? I was wondering if, since Ssal_v3.1 is relatively recent, if the annotation of GO Terms to the reference genome is still 'catching up'? Does that make sense?
Summarizing, 2022 plot used ICSASG_v2 and AH107424, while 2024 plot used Ssal_v3.1 and AH114250. The sequencing data input is the same for both plots.


