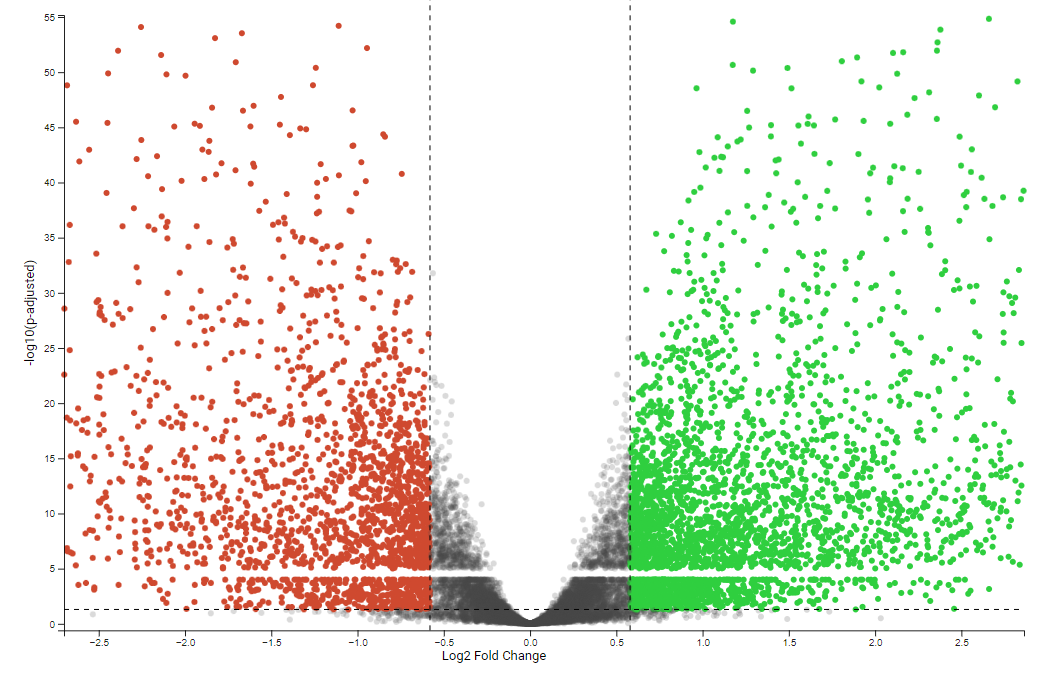
I am running DESeq2, and am running into a problem where when I plot the results as a volcano plot, I am experiencing this "missing band" of data. The missing band goes from the range (4.0, 5.0] on the -log10(padj) y axis.
As far as I can tell, the values that should be there all have a baseMean of 0, and then 0 or undefined p-values/padj. I understand that baseMean 0 arises when a gene has zero expression across all samples, however why is it all concentrated in this range? I have tried disabling cook's cutoff and independent filtering to see if they were "erasing" these p-values, but to no success. Some other thoughts have been a precision error, but we are clearly seeing points both above and below this range. Any idea what may be causing this?
Here is the relevant code:
Preprocessing
 expression_data <- loadedData$expression_data
  cohort_A <- loadedData$cohort_A
  cohort_B <- loadedData$cohort_B

  start_time <- Sys.time()

  cat("Preprocessing data for DESeq2...\n")

  # Print number of genes
  cat("Number of genes:", nrow(expression_data), "\n")

  # Combine cohort data with appropriate condition labels
  cat("Combining cohort data\n")
  cohort_data <- rbind(cohort_A, cohort_B)
  cohort_data$Condition <- ifelse(cohort_data$cohortName == "A", "A", "B")
  cohort_data <- cohort_data[, c("sids", "Condition")]
  rownames(cohort_data) <- cohort_data$sids

  # Create counts_matrix
  cat("Creating counts matrix\n")
  counts_matrix <- as.data.frame(expression_data$counts)
  colnames(counts_matrix) <- expression_data$geneID

  cat("Counts matrix size:", dim(counts_matrix), "\n")

  # Filter out samples not in cohort A or B
  cat("Filtering out samples that are not in cohort A or B\n")
  samples_to_keep <- rownames(counts_matrix) %in% rownames(cohort_data)
  counts_matrix <- counts_matrix[samples_to_keep, ]

  cat("Counts matrix size:", dim(counts_matrix), "\n")

  # Filter out cohort members not in counts matrix
  cat("Filtering out cohort members that are not in counts matrix\n")
  samples_to_keep <- rownames(cohort_data) %in% rownames(counts_matrix)
  cohort_data <- cohort_data[samples_to_keep, , drop = FALSE]

  # rename cohort data columns
  colnames(cohort_data) <- c("Sample", "Condition")

  cat("Counts matrix size:", dim(counts_matrix), "\n")
  cat("Cohort data size:", dim(cohort_data), "\n")

  # Sort indices
  cat("Sorting indices\n")

  counts_matrix <- counts_matrix[match(rownames(cohort_data), rownames(counts_matrix)), ]

  # Transpose counts_matrix
  cat("Transposing counts matrix\n")
  counts_matrix <- t(counts_matrix)


  cat("\nFinal preprocessed data dimensions:\n")
  cat("Counts matrix size:", dim(counts_matrix), "\n")
  cat("cohort_data size:", dim(cohort_data), "\n")

  cat("PREPROCESSING FINISHED. Runtime (s):", as.numeric(Sys.time() - start_time), "\n")
And then DESeq2
  counts_matrix <- preprocessed$counts_matrix
  cohort_data <- preprocessed$cohort_data

  # Run DESeq
  dds <- DESeqDataSetFromMatrix(countData = counts_matrix, colData = cohort_data, design = ~Condition)
  print(dds)

  # Run DESeq2 analysis
  dds <- DESeq(dds)

  # Extract results
  res <- results(dds, contrast=c("Condition", "A", "B"), alpha=0.05)


Does the same happen with the nominal (aka not multiple-testing corrected pvalues)? Could be some odd behaviour of how BH corrects the pvalues at exactly that boundary.
Side note: It is good practice to show only relevant code, so for the future please remove all these cat and time log elements from the code. It does not add to the question and only makes it laborious to see the relevant lines.