Entering edit mode

Hey everyone,
I know the plotPCA function from DESeq2uses, by default, only the 500 most variable genes. I was wondering if it makes sense, or if anyone has done, a plot where we check the explained variance by PC1 and PC2 as a function of the number of genes considered.
Something like this:
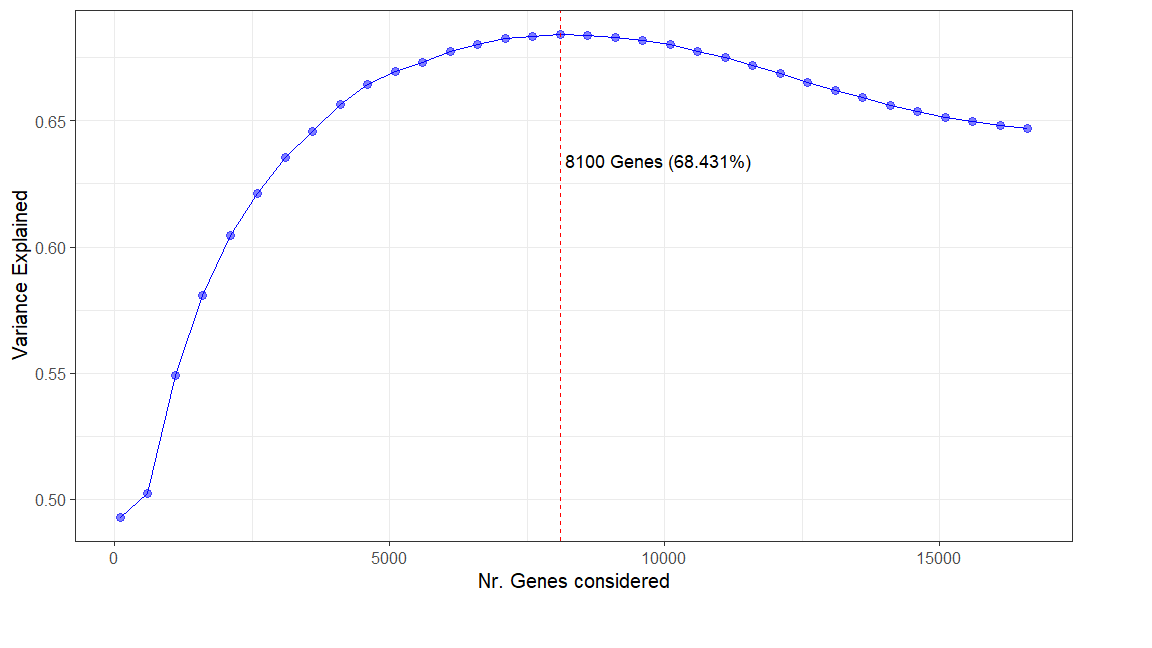
Where X is the Number of Genes considered and Y is the sum of variance explained by the first 2 PC's.
Thank you in advance!

Indeed, we are constantly changing the amount of variance in our data. But, this was the best way to get a better "grasp" on what would be the right amount of genes that, at that level of variance, a 2 PC PCA plot could better explain that variance - does this make sense? Would you do it in a different way?
I was maybe thinking about including more PC's (up to 3 or 4), which we can then plot in pairwise fashion (PC1 vs PC2, PC1 vs PC3, ...). What do you think?
I mean exploring your data in many ways is always a good idea (here I don't mean doing a bunch of null hypothesis testing, but EDA), can't go wrong.