How can I create a GO plot with ggpubr and clusterProfiler libraries (begginer)
1
0
Entering edit mode
BCS12 • 0
@d76fa487
Last seen 22 days ago
United States

hello

I am a beginner who just started using rstudio (I just know how to make a Venn diagram in R).

I tried to create a GO plot using usegalaxy, but they did not provide detailed plots for CC, BP, and MF (probably because my organism is not a widely known organism such as human or mouse).

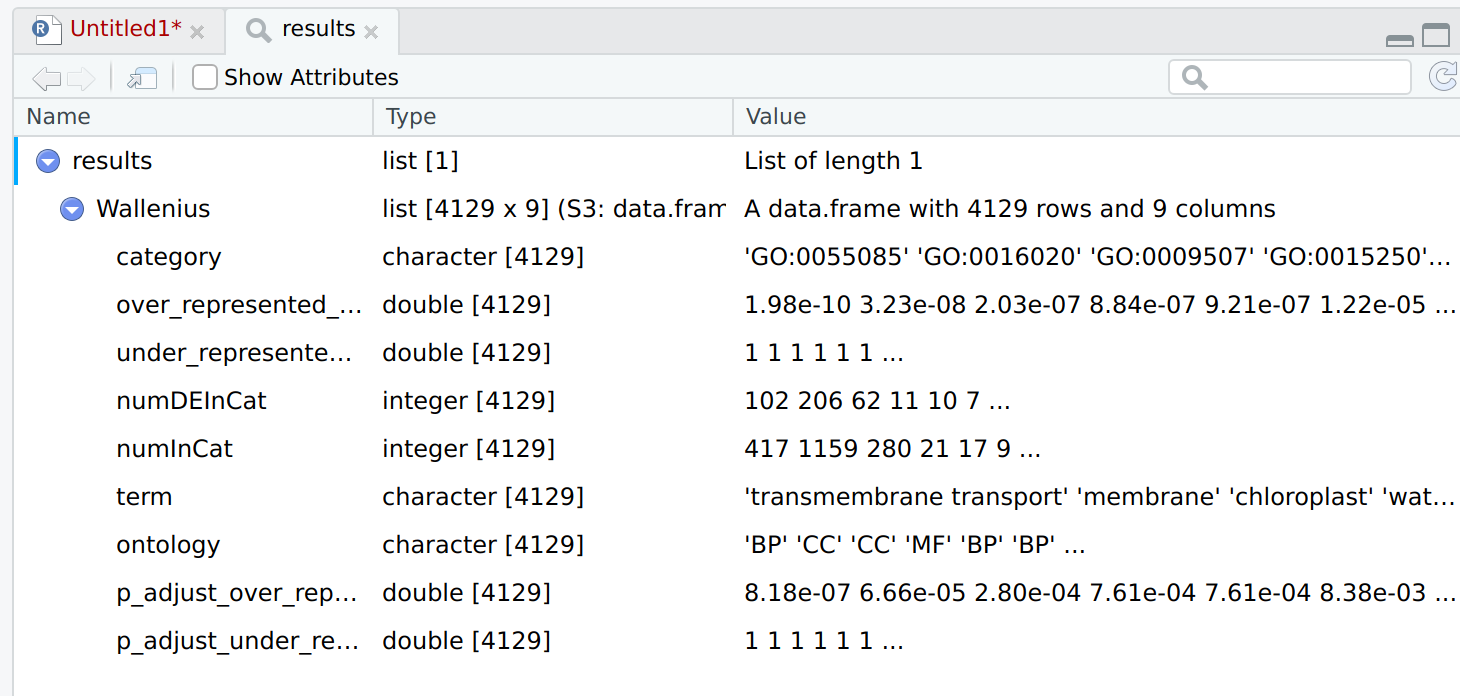
I have a goseq result file annotated as below.

Is there anyone who can give me some help or comment..?

enter image description here

clusterProfiler ggpubr • 171 views
ADD COMMENT
0
Entering edit mode
@james-w-macdonald-5106
Last seen 17 hours ago
United States

There's a whole book for clusterProfiler that covers pretty much everything. As a beginner, you will have to become familiar with all types of help available, and this is a good place to start.

Login before adding your answer.

Traffic: 704 users visited in the last hour
Help About
FAQ
Access RSS
API
Stats

Use of this site constitutes acceptance of our User Agreement and Privacy Policy.

Powered by the version 2.3.6