Entering edit mode

Dear all,
I am using the compareCluster function of clusterProfiler to do GSEA, and I then plot the results with the dotplot function.
While most of the parameters of the dotplot remain the same if you input a gseaResult or a compareClusterResult, the arguments "groupBy" and "decreasing" do not exist and the argument "by" does not seem to work.
In the following example I am trying to order the genesets by the NES value.
dotplot(
  result_gsea_mitocarta,
  x = "NES",
  color = "p.adjust",
  showCategory = 8,
  split = "Cluster",
  font.size = 12,
  title = "",
  by = "NES",
  size = "Count",
  includeAll = TRUE,
  label_format = 30
) +
  facet_grid(. ~ Cluster) +
  geom_vline(xintercept = 0, linetype = "dotted", color = "#444444", size = 1) +
  scale_x_continuous(limit = c(-3.5, 3.5), breaks = seq(-4, 4, 1))


sessionInfo( )
R version 4.2.2 (2022-10-31 ucrt)
Platform: x86_64-w64-mingw32/x64 (64-bit)
Running under: Windows 10 x64 (build 19045)

Matrix products: default

locale:
[1] LC_COLLATE=French_Switzerland.utf8  LC_CTYPE=French_Switzerland.utf8    LC_MONETARY=French_Switzerland.utf8 LC_NUMERIC=C
[5] LC_TIME=French_Switzerland.utf8

attached base packages:
[1] stats4    stats     graphics  grDevices utils     datasets  methods   base

other attached packages:
 [1] RColorBrewer_1.1-3     Rtsne_0.17             umap_0.2.10.0          plotly_4.10.4          factoextra_1.0.7       FactoMineR_2.10        EnhancedVolcano_1.16.0
 [8] ggrepel_0.9.5          msigdbr_7.5.1          org.Hs.eg.db_3.16.0    AnnotationDbi_1.60.2   IRanges_2.32.0         S4Vectors_0.36.2       clusterProfiler_4.6.2
[15] pheatmap_1.0.12        ggforce_0.4.2          tidytree_0.4.6         lubridate_1.9.3        forcats_1.0.0          stringr_1.5.1          purrr_1.0.1
[22] readr_2.1.5            tidyr_1.3.1            tibble_3.2.1           tidyverse_2.0.0        readxl_1.4.3           CellChat_2.1.2         Biobase_2.58.0
[29] BiocGenerics_0.44.0    ggplot2_3.5.0.9000     igraph_2.0.2           dplyr_1.1.4

loaded via a namespace (and not attached):
  [1] estimability_1.4.1     R.methodsS3_1.8.2      coda_0.19-4.1          bit64_4.0.5            R.utils_2.12.3         irlba_2.3.5.1          styler_1.10.2
  [8] data.table_1.14.8      KEGGREST_1.38.0        RCurl_1.98-1.12        doParallel_1.0.17      generics_0.1.3         snow_0.4-4             callr_3.7.5
 [15] cowplot_1.1.3          usethis_2.2.3          RSQLite_2.3.1          shadowtext_0.1.3       future_1.33.1          bit_4.0.5              tzdb_0.4.0
 [22] enrichplot_1.23.1.992  httpuv_1.6.14          viridis_0.6.5          hms_1.1.3              jquerylib_0.1.4        babelgene_22.9         promises_1.2.1
 [29] fansi_1.0.3            DBI_1.2.2              htmlwidgets_1.6.4      ellipsis_0.3.2         RSpectra_0.16-1        ggnewscale_0.4.10      ggpubr_0.6.0
 [36] backports_1.4.1        gridBase_0.4-7         vctrs_0.6.4            ggalluvial_0.12.5      remotes_2.4.2.1        abind_1.4-5            cachem_1.0.8
 [43] withr_3.0.0            HDO.db_0.99.1          presto_1.0.0           emmeans_1.10.0         sna_2.7-2              treeio_1.22.0          svglite_2.1.3
 [50] cluster_2.1.6          DOSE_3.24.2            ape_5.7-1              lazyeval_0.2.2         crayon_1.5.2           labeling_0.4.3         pkgconfig_2.0.3
 [57] tweenr_2.0.3           GenomeInfoDb_1.34.9    nlme_3.1-164           pkgload_1.3.4          devtools_2.4.5         rlang_1.1.3            globals_0.16.2
 [64] lifecycle_1.0.4        miniUI_0.1.1.1         downloader_0.4         registry_0.5-1         cellranger_1.1.0       polyclip_1.10-6        matrixStats_1.2.0
 [71] rngtools_1.5.2         Matrix_1.6-3           aplot_0.2.2            carData_3.0-5          GlobalOptions_0.1.2    processx_3.8.3         png_0.1-8
 [78] viridisLite_0.4.2      rjson_0.2.21           bitops_1.0-7           R.oo_1.26.0            gson_0.1.0             ggnetwork_0.5.13       Biostrings_2.66.0
 [85] blob_1.2.4             shape_1.4.6.1          multcompView_0.1-9     qvalue_2.30.0          parallelly_1.37.1      R.cache_0.16.0         rstatix_0.7.2
 [92] gridGraphics_0.5-1     ggsignif_0.6.4         scales_1.3.0           leaps_3.1              memoise_2.0.1          magrittr_2.0.3         plyr_1.8.9
 [99] zlibbioc_1.44.0        compiler_4.2.2         scatterpie_0.2.1       clue_0.3-65            cli_3.6.0              XVector_0.38.0         urlchecker_1.0.1
[106] listenv_0.9.1          patchwork_1.2.0        pbapply_1.7-2          ps_1.7.6               MASS_7.3-60.0.1        tidyselect_1.2.0       stringi_1.8.2
[113] GOSemSim_2.24.0        askpass_1.2.0          grid_4.2.2             sass_0.4.8             fastmatch_1.1-4        tools_4.2.2            timechange_0.3.0
[120] future.apply_1.11.1    parallel_4.2.2         circlize_0.4.16        rstudioapi_0.15.0      foreach_1.5.2          gridExtra_2.3          scatterplot3d_0.3-44
[127] farver_2.1.1           ggraph_2.2.0           digest_0.6.34          FNN_1.1.4              shiny_1.8.0            Rcpp_1.0.11            car_3.1-2
[134] broom_1.0.5            later_1.3.2            httr_1.4.7             ComplexHeatmap_2.15.4  colorspace_2.1-0       fs_1.6.3               reticulate_1.35.0
[141] splines_4.2.2          yulab.utils_0.1.4      graphlayouts_1.1.0     ggplotify_0.1.2        sessioninfo_1.2.2      systemfonts_1.0.5      xtable_1.8-4
[148] jsonlite_1.8.8         ggtree_3.6.2           tidygraph_1.3.1        flashClust_1.01-2      ggfun_0.1.4            R6_2.5.1               profvis_0.3.8
[155] pillar_1.9.0           htmltools_0.5.7        mime_0.12              NMF_0.27               DT_0.32                glue_1.6.2             fastmap_1.1.1
[162] BiocParallel_1.32.6    BiocNeighbors_1.16.0   codetools_0.2-19       fgsea_1.24.0           mvtnorm_1.2-4          pkgbuild_1.4.3         utf8_1.2.2
[169] lattice_0.20-45        bslib_0.6.1            network_1.18.2         curl_5.2.1             GO.db_3.16.0           openssl_2.1.1          statnet.common_4.9.0
[176] desc_1.4.3             munsell_0.5.0          GetoptLong_1.0.5       GenomeInfoDbData_1.2.9 iterators_1.0.14       reshape2_1.4.4         gtable_0.3.4
And I get the the following plot:
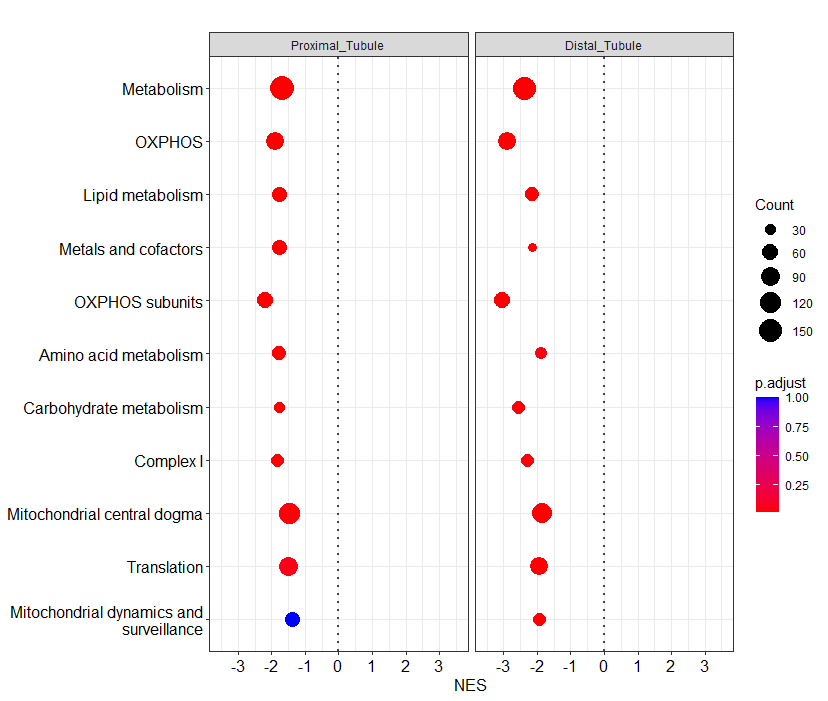
Any idea on how to change the order of the genesets?
Thanks a lot for the help
Lucie
It is not fully clear what you try to achieve. Note that if you would like to plot some specific gene sets, you can do this by providing a character vector as input for the argument
showCategory.Below some code for inspiration.
How would it be possible to order the genesets alphabetically ? (or using a custom defined order)