Why p value inconsistent when using different number of pathway score?
2
1
Entering edit mode
Chris ▴ 20
@3fdb6f97
Last seen 3 months ago
United States

Hi all,

I have a question that don't know why, hope you can help. I use GSVA (Gene Set Variation Analysis) package to calculate pathway scores. Then I compare pathway scores between 3 groups using limma. When I use a few thousand pathways, raw p value of pathway A will different (bigger) with when I use only a few pathways. I think it should be the same because each pathway is independent (adj p value changes because number of comparison change). Basically, it is a Anova test (anova like F test). Can't use Deseq2 because it apply to count data only. I manually run aov() for each pathway and the weird things is in some cases, p value almost the same, some cases, p value larger, some cases, p value smaller. Would you please have an explanation and which practice I should do in this case? Thank you so much!

limma • 2.1k views
ADD COMMENT
2
Entering edit mode
ATpoint ★ 4.5k
@atpoint-13662
Last seen 3 days ago
Germany

Same answer as here: Light difference when using coef vs omit a group when compare 3 groups.

Adding or removing data (samples, genes, pathways, observations...) changes results.

You keep posting essentially the same problem for weeks now. Take results and see whether you can follow any of it up to drive your project forward. Sticking to these sorts of problems you're currently posting about is not going to give you any interesting biology. Decide for one strategy and go forward.

ADD COMMENT
0
Entering edit mode

Thanks ATpoint for you advice. Just don't understand the math behind the change in raw p value in this case. I think it is important to understand because it helps me decide which way should go. It likes find if salty in 3 type of pizza is different, I got a raw p value. Then why adding to find if salty in 3 type of chicken is different change the raw p value of pizza. A naive thought pizza and chicken is independent.

ADD REPLY
2
Entering edit mode

It seems that you are thinking that when you look at the results of limma for a particular gene, or pathway if you want, those results were derived using only the data from that very gene or that very pathway and that's not true. limma uses a empirical Bayes procedure by which all data points from the whole dataset are employed to get more robust estimates of the variabiliy of each gene, or pathway when you feed limma with GSVA scores. For that reason, depending what data you feed into limma, the results may change. ATpoint already pointed you to a previous post discussing this matter. Ultimately, if you want to understand the math, you'll have to read papers.

ADD REPLY
0
Entering edit mode

Thanks Robert! Please correct me if I am wrong, so using more pathways (feeding more data in limma) gives us more accurate raw p value?

ADD REPLY
1
Entering edit mode

Yes, it is important that you feed all the pathways into limma, so that limma can robustly estimate the variances, even if you only going to use the results for a few selected pathways.

ADD REPLY
2
Entering edit mode
@gordon-smyth
Last seen 10 hours ago
WEHI, Melbourne, Australia

The reason why limma is recommended over just running t.test() or lm() or aov() row by row is because limma borrows information between genes (pathways in this case) to get more reliable estimates of the variances. Since limma is borrowing information from all the genes (pathways) at once when making conclusions about each gene (pathway), the results must obviously change if you add more rows to the dataset. It also follows that you should give the entire dataset to limma instead of feeding it just a few rows.

This question is one of a series of similar questions that you've posted here and to Biostars. You decided to use anova because it is better than individual pairwise t-tests, but then you were surprised that it doesn't give exactly the same results as pairwise t-tests. You decided to use limma because it is better than running rowwise anovas (so you said two months ago and so you were advised by the GSVA vignette and elsewhere) but now you complain that it doesn't give exactly the same results as rowwise anova. You seem to be expecting that more sophisticated statistical tests must necessarily give the same results as simpler tests and that seems a basically illogical position.

You have been given a lot of help on this same dataset over the past many weeks. Robert Castelo even made changes to the GSVA package specially so that you could optimise your limma analysis of the GSVA pathways scores. The purpose of that refinement was to borrow information between pathways even more effectively. I have previously explained to you ( Light difference when using coef vs omit a group when compare 3 groups. ) that your whole analysis is flawed right from the beginning because you have failed to model the fundamental experimental design of your data. You don't seem have responded with any attempts to make a more realistic analysis of your data. Your question here seems to be going backwards rather than forwards with the analysis.

ADD COMMENT
0
Entering edit mode

Thanks Gordon! I really appreciate your help! Maybe I don't know how to make the right effort which make me go back and forth. Just keep trying and learning along the way. About the experimental design, psychiatrist doesn't expect significant difference in gene expression from peripheral blood between normal control and Alzheimer patients. But expect maybe there are pathways behave differently. I think that why the MDS plot at gene level doesn't cluster as usual.

ADD REPLY
1
Entering edit mode

I don't think that your scientific reasoning here is correct. If there is no DE at the gene level, then it is also very unlikely that there will be any significant DE in terms of single-sample pathway scores.

I wish you well with your analysis but I think I have told you everything I can and I will leave your questions to other people in the future.

ADD REPLY
0
Entering edit mode

The father of the tool answered so I don't expect a better one. Thank you so much! That hypothesis is from my PI. If I use p adj, no gene and also pathway is significant because the number of comparison is very big (thousands). But if I pick only a few pathways of interested, there are pathways have p adj significant. Not sure if I must stop here or there is other possibility to keep going. I am still a junior in the field, so there is a lot to learn.

ADD REPLY
2
Entering edit mode

What you observe is intrinsic to what a multiple testing correction does with the function p.adjust(), the more p-values you have to correct, the more severe the correction is. That's also one of the reasons why, upfront, it is helpful to filter out lowly expressed genes, or pathways with too few genes that makes their scores less robust, or pathways with too many genes that make them too general, because it also helps alleviating the multiple testing problem. Using subsets of the data until you find one that gives the desired results is a form of p-hacking, which may lead to the result you are looking for, but it is unlikely that this result will replicate (that others will find that pathway changing in their own analogous dataset), which is what science is about.

ADD REPLY
0
Entering edit mode

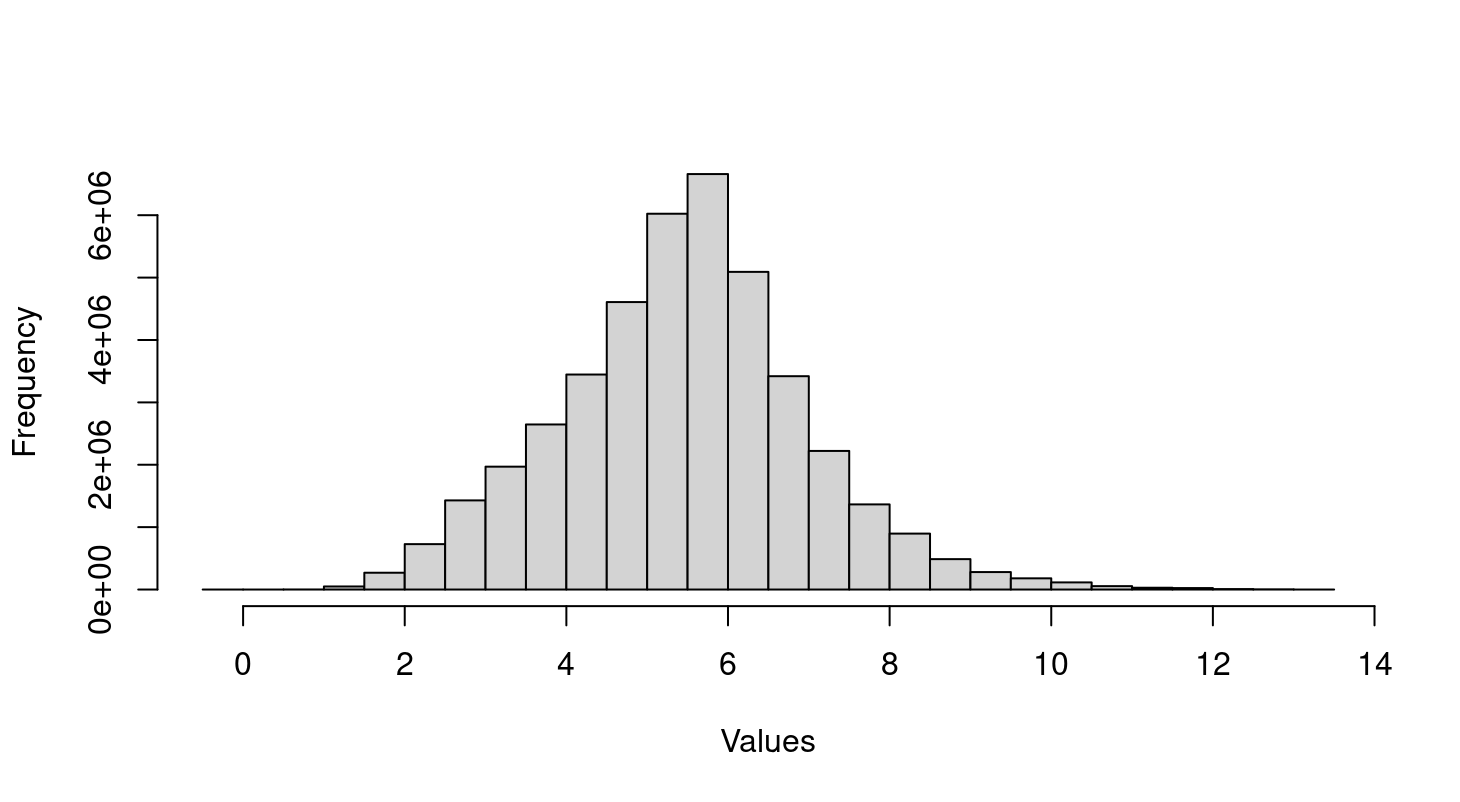
Thanks Robert for your advice! Would you please suggest the min and max set size that is considered not too few genes or too many genes? Currently I try to get all the pathways in c2 gene set, so I put min 2 and max 800. Turn out it is not a good way. How about min gene set size 10 and max 300? This is the distribution of microarray value after normalized and log transform. I plan to filter value < 1 before running GSVA. But I think it won't change the result much. enter image description here

ADD REPLY
2
Entering edit mode

A minimum gene set size of 10 and a maximum of 300 sounds reasonable, but I recommend you doing that filtering through the gsvaParam() function using the parameters minSize and maxSize, because gene set size filtering should be done after mapping features between gene sets and expression data, and GSVA takes care of that.

ADD REPLY
0
Entering edit mode

Hi Robert, if two conditions don't have hundreds of differential express genes ( in some conditions such as peripheral blood Alzheimer vs normal), is it possible with GSVA, I can find pathways behave different between two conditions? Do you think changes may be subtle at the gene level but more pronounced when looking at coordinated changes across sets of genes within pathways? Gordon comments above made me rethink about my current method. I try to find if there are papers using this method in non DEG sample and find interesting things at pathway level.

ADD REPLY
1
Entering edit mode

One of the ideas introduced by the seminal paper on GSEA by Subramanian et al. (2005) was that of conducting a gene set analysis that does not depend on a specific list of differentially expressed (DE) genes. You could try using this classical GSEA analysis with the Bioconductor package fgsea. If you give a try to fgsea and have questions about it, please do not post your questions replying to this thread. Instead, open a new post and include fgsea as a tag to get an answer from the maintainer of the package.

Going back to your questions, their answer depends specifically on what was the experimental design employed to generate the data, i.e., the input data, and also on the other essential input for any kind of pathway analysis, which is the collection of gene sets that you use in that analysis. If the data was not correctly generated to answer your question, or if you do not have a collection of gene sets that is relevant to the pathways that are involved in what you are studying, then no matter what method you are using, you will not find sensible results.

ADD REPLY
1
Entering edit mode

Just a note that fgsea is not classical GSEA. The classical GSEA as described in the Subramanian paper and other papers from the Broad Institute is based on sample permutation. fgsea instead implements pre-ranked GSEA, which is quite different. Pre-ranked GSEA ignores correlations between genes and gives wildly inflated significance. The GSEA website does not recommend pre-ranked GSEA but instead recommends that users apply edgeR's cpm or DESeq's vst and input the resulting log-expression values into the classical GSEA procedure.

As I already suggested to Chris weeks ago, an alternative is to use the limma camera method, which is analogous to GSEA and does correct for inter-gene correlation.

The GSVA pathway score method also allows for inter-gene correlations because significance is re-assessed using the individual sample scores.

ADD REPLY
0
Entering edit mode

Thanks Gordon for a detail guide! You have a great memory of time. GSVA also do differential express at pathway level (https://bioconductor.org/packages/devel/bioc/vignettes/GSVA/inst/doc/GSVA.html#62_Differential_expression_at_pathway_level) which also implement limma. Would you please have a comment the different between this way vs camera()? Maybe Robert also can help with this question. Seem with the purpose to find if pathway A behave different between two conditions, both camera() or GSVA() follow limma can do the job. I am not 100% sure, hope to hear your opinion.

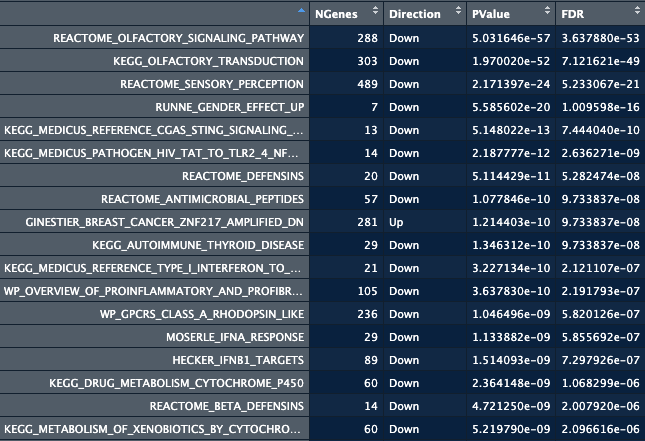
Update: unlike using limma (no pathway pass FDR < 0.05), camera() gave me a lot of FDR significant result (602 per 7233 pathways FDR < 0.05). Could I said the activity of top pathways most different between 2 conditions? The direction of some pathways from camera also opposite with pathway score from GSVA which I am confused. Running GSVA to get pathway score then limma to compare them between 2 conditions, the order of significant pathways are very different with camera. I think the idea of gsva() and camera() is fundamentally different that why the result is different. Camera() compare genes within a pathways vs genes not in the pathway. To find is that pathway A activity different between 2 condition because of the condition but not by chance. enrichGO() also rank the pathway. Back to the research question to find pathway that behave different between 2 conditions, I think gsva() is more appropriate. Tried fgsea() and I have 87 pathways with padj < 0.05. enter image description here

ADD REPLY
0
Entering edit mode

Thanks Robert for an educative response!

ADD REPLY

Login before adding your answer.

Traffic: 794 users visited in the last hour
Help About
FAQ
Access RSS
API
Stats

Use of this site constitutes acceptance of our User Agreement and Privacy Policy.

Powered by the version 2.3.6