I have 160 samples for a bulk-RNASeq project; 138 are of condition "X" that I (currently) don't care about, and the remaining 22 are of the investigated condition "Y" that is of interest. Condition "Y" has 6 subgroups (A-F), which are very small, 2-7 samples each, and I want to compare them.
Thus, I've created a model matrix of each subgroup (using the formula: ~0 + subgroup), and each has the following number of samples:
| X | Y_A | Y_B | Y_C | Y_D | Y_E | Y_F |
|---|---|---|---|---|---|---|
| 138 | 7 | 4 | 3 | 3 | 3 | 2 |
_
Samples from condition "X" were kept for analysis as was suggested here.
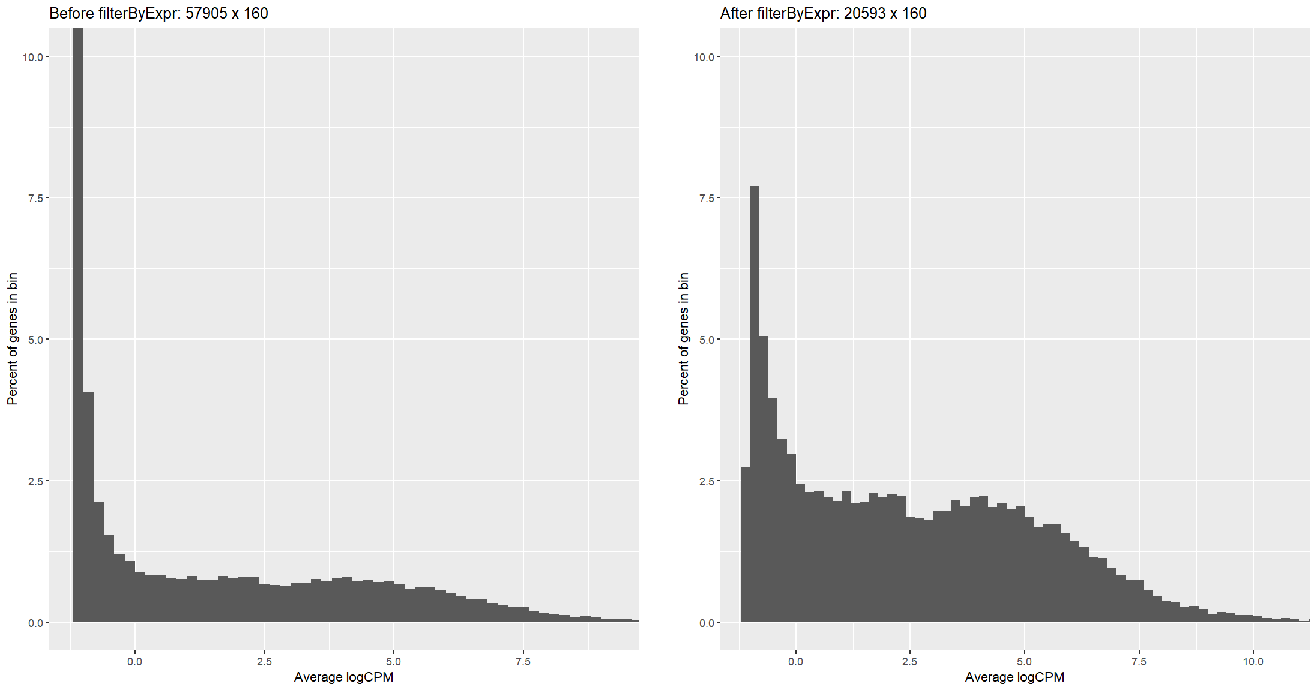
Running FilterByExpr filtered most of the symbols (57905 => 20593) but with too many low-reads; I can tell this by creating a histogram:
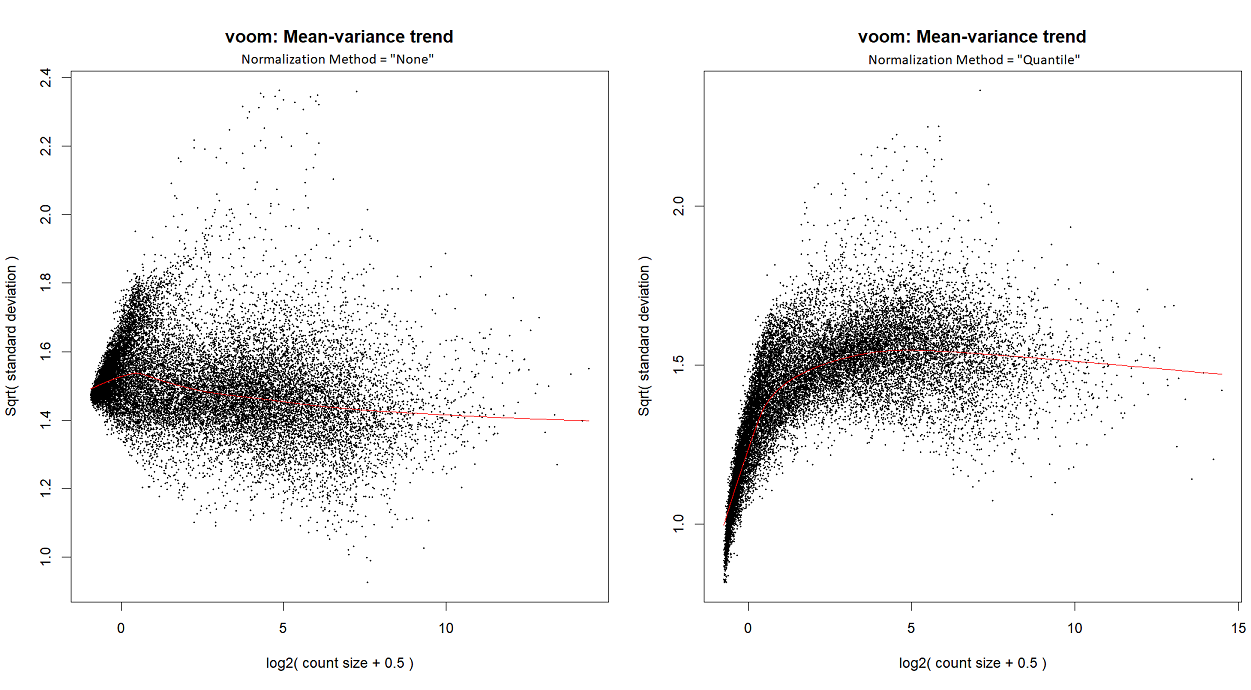
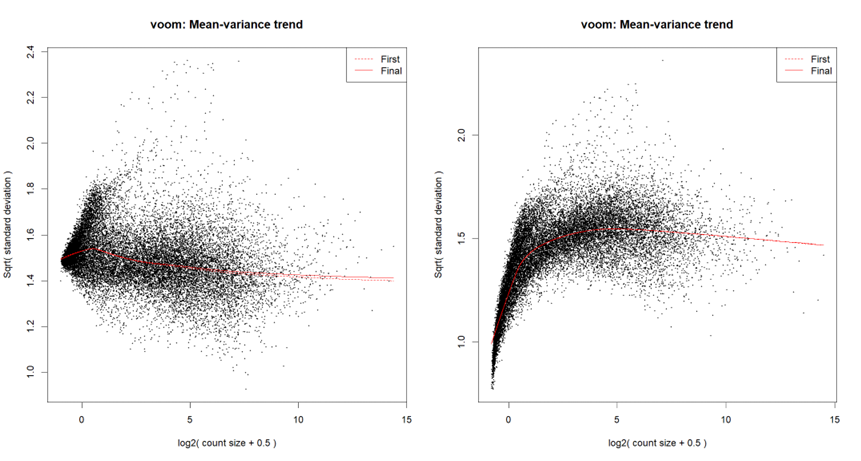
...or by looking at the voom plot, which looks... hideous:
So,
- Did I do something wrong?
- Should I change the
FilterByExprparameters? - Should I filter differently, e.g., by taking some minimal
AveLogCPMfrom the entire cohort?- Or only genes that pass a certain
AveLogCPMfrom BOTH X and from Y? - Or perhaps genes that
AveLogCPMpass each of the 7 subgroups independently?
- Or only genes that pass a certain
Any suggestion is welcomed!


Are you running
voomorvoomLmFit? Did you runnormLibSizes()in edgeR prior tovoom? Are you starting with counts?Usually I run
voomLmFit, although in order to create the mean-variance trend plots for this particular post, I ranvoom; I've checked - they both yield a similar plot.I'm starting with counts (in the following snippet, exprs.mat holds counts), and I run
calcNormFactorsinstead ofnormLibSizes. My code is as follows:For quantile normalization, I don't use TMM (as explained here), so the last line is