
We sequencing data that corresponds to decay of RNA species over time. This data can be through of as a matrix of counts with rows being different genes, and columns being three different time points. We have triplicates of this data.
After a while thinking about how to analyse this data, I realised that the most suitable way is probably by a negative binomial GLM: in a negative binomial GLM a model formula of counts ~ 1 + time corresponds to a exponential curve of the form counts = a*exp(b*time), and that the DESeq2 approach to estimating disperisions should be suitable.
Note that we are not trying to find the difference in decay rate between two conditions, but rather rank genes by their decay rate in a single condition. That is, in the above model, we are interested in ranking genes by the b coefficient.
However, I have several issues with this.
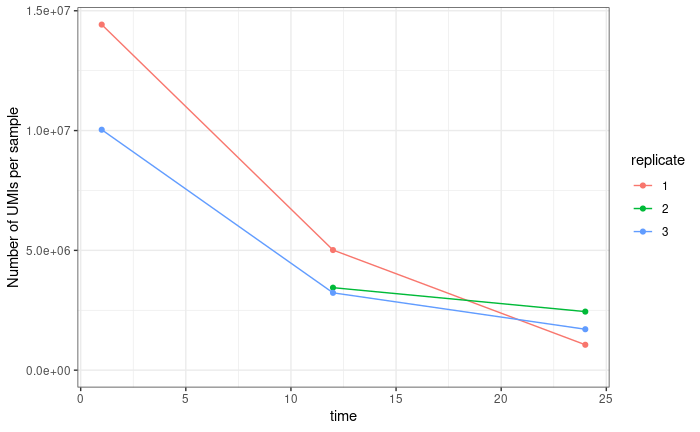
The first is normalisation. Standard DESeq normalisation assumes that the mean difference between samples is 0. However, this not true of our data. We know that the later time points contain lower counts than the earlier time points, and we expect (in fact require) that the time coefficient for all genes is negative. Because we use UMIs our data is not (or at least not perfectly) compositional. In samples where sequencing is saturated (that is we have sequenced every molecule present in our cDNA tube) we don't expect counts from highly expressed genes to crowd out counts from lowly expressed genes. This is true for the latest of our three time points (via subsampling saturation curves), but not for our first time point (the middle time point is somewhere in between). If we sum counts for all genes in a sample, we get something that looks like a decay curve:
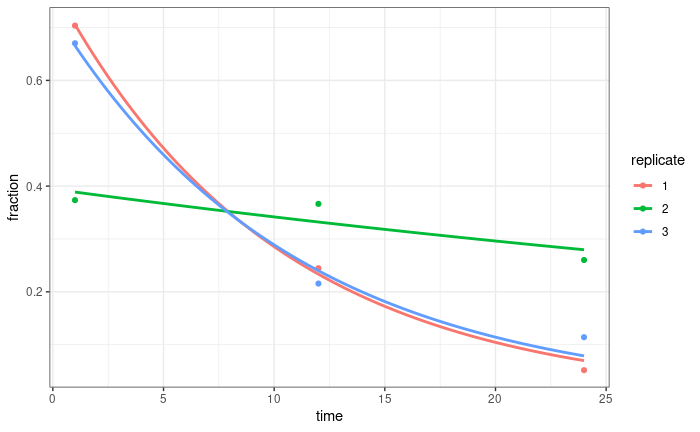
If we normalise by the sum of all UMIs for all time points in a replicate, that does a pretty good job normalising these curves (at least for two of the replicates, we are repeating sequencing for the third):
I thought about using this to calculate normalisation factors for DESeq (probably sizeFactors = total_count/exp(mean(log(total_count)))). Any thoughts on this? Just because it works well for the total counts, doesn't mean it will work well for individual genes, but I'm not entirely sure how I might test that?
The second issues is assessing the quality of the fits. We want to find the genes with the lowest (but still positive) decay rate. Trouble is, the whole linear modeling framework is set up to find the biggest decay rates (that is the bigger p-values are to genes where the coefficient is most confidently different from 0). But if we just rank genes of the value of the coefficient, the genes with the smallest coefficient tend to be genes that fit the model poorly, often with negative decay rates.I feel like we should be able to use the standard error estimates in some way, but i'm not quite sure how? Or some other metric on the quality of the fits?
Is all this just bonkers? Am I trying to force something into a purpose for which it wasn't designed?
