Entering edit mode
Hi all,
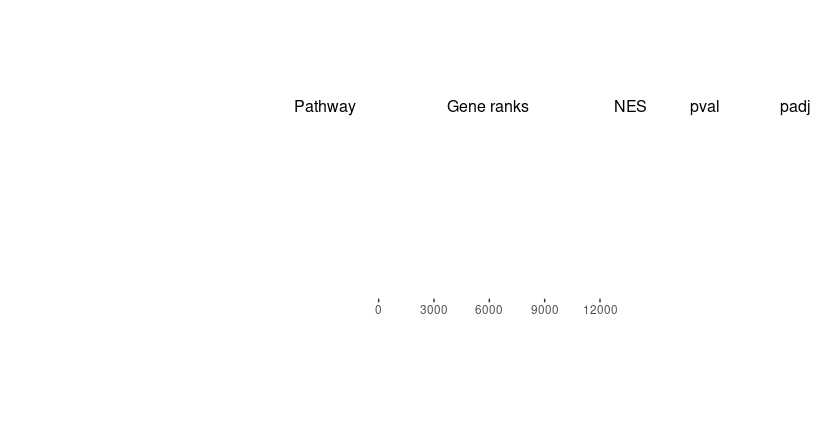
I try to make plot as the tutorial using the same code:
    stats <- with(results, setNames(logFC, row.names(results)))
    fgseaRes <- fgsea(pathways = c2_list, stats = stats, minSize=15, maxSize=500)
    topPathwaysUp <- fgseaRes[ES > 0][head(order(pval), n=10), pathway]
    topPathwaysDown <- fgseaRes[ES < 0][head(order(pval), n=10), pathway]
    topPathways <- c(topPathwaysUp, rev(topPathwaysDown))
    plotGseaTable(topPathways, stats, fgseaRes,
                  gseaParam=0.5)
https://bioconductor.org/packages/devel/bioc/vignettes/fgsea/inst/doc/fgsea-tutorial.html
Would you please have a suggestion? topPathwaysUp, topPathwaysDown and topPathways have the correct values.
I have 87 pathways that padj < 0.05. Depend on NES positive or negative, could I say these pathways is more or less active in diseased groups compare with control? Thank you so much!
Update: this worked.
plotGseaTable(c2_list[topPathways], stats, fgseaRes,
              gseaParam=1)


