
I'm running RAIN analysis in R and I'm having trouble with the output. I tried contacting the original authors of the package rain but their emails are inaccessible behind a securty wall.
I don't understand what some of the options mean, such as "period". I want to see the rhythmicity over 24h periods but I have data for two days. They are not replicates but rather two 24h hour periods with separate patterns. Do I need to run each 24h period separately?
My situation in more detail: I have 9 timepoints over 48h (twice diel, measured every 6h) in two seasons (actually 49h because the last timepoint is again the same time as the first timepoint), so 9x timepoints. The code is below.
Is my period still 24 or 48h? Do I count the corresponding same-time samples as replicates? Or does RAIN calculate diel pattern and it knows that there are two days included given that the periodicity is 6h and there are 9 samples? Should I split the samples into individual 24h?
When I run the code above it tells me quite a few OTUs have diel rhythmicity but when I look at their normalised counts over the timepoints the pattern doesn't look very rhythmic to me.
Also, I went to make an Excel line chart with the supposedly rhythmic groups and it switched around the columns and rows and the output looks like this:
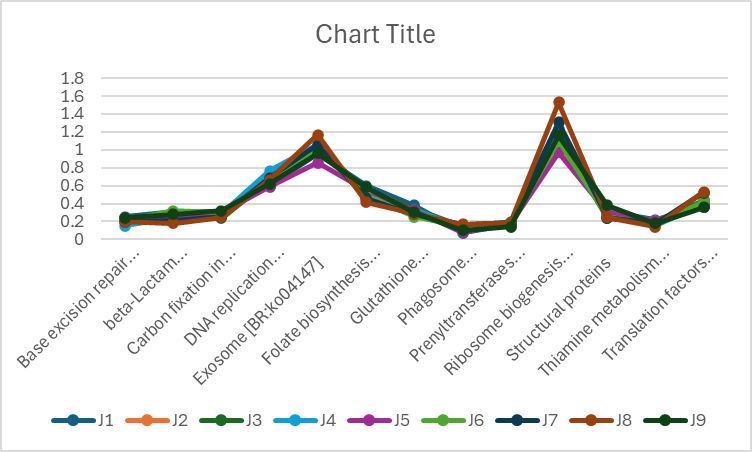
Which looks more rhythmic than the correct way around:
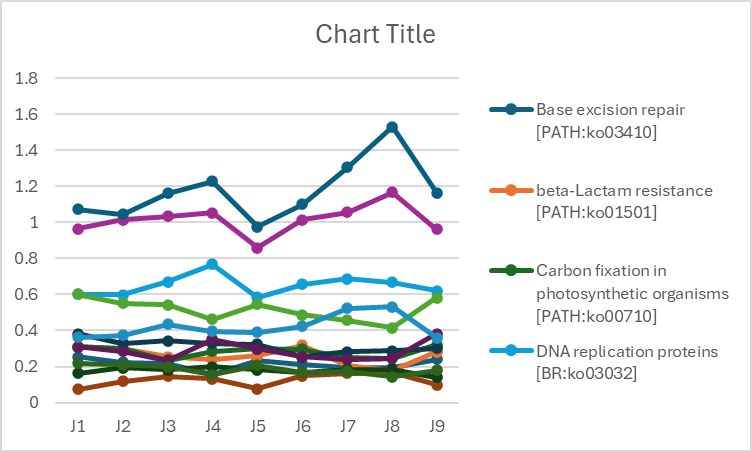
Is the RAIN analysis mixing up rows and columns? I tried running it with the two inverted and it gave me errors. Is it that I chose the wrong period number? I also tried running the corresponding values for the two days as replicates and it still gives me output that does not seem rhythmic at all when I plot it.
Thanks for your help.
```sessionInfo( ) R version 4.4.1 (2024-06-14 ucrt) Platform: x86_64-w64-mingw32/x64 Running under: Windows 10 x64 (build 19045)
Matrix products: default
locale:
1 LC_COLLATE=English_Hong Kong SAR.utf8
2 LC_CTYPE=English_Hong Kong SAR.utf8
[3] LC_MONETARY=English_Hong Kong SAR.utf8
[4] LC_NUMERIC=C
[5] LC_TIME=English_Hong Kong SAR.utf8
time zone: Asia/Hong_Kong tzcode source: internal
attached base packages:
1 stats graphics grDevices utils datasets methods
[7] base
other attached packages:
1 gage_2.54.0 rain_1.38.0 multtest_2.60.0
[4] Biobase_2.64.0 BiocGenerics_0.50.0 gmp_0.7-4
[7] pracma_2.4.4 compositions_2.0-8
loaded via a namespace (and not attached):
1 KEGGREST_1.44.1 SummarizedExperiment_1.34.0
[3] gtable_0.3.5 tensorA_0.36.2.1
[5] ggplot2_3.5.1 lattice_0.22-6
[7] vctrs_0.6.5 tools_4.4.1
[9] generics_0.1.3 curl_5.2.1
[11] stats4_4.4.1 parallel_4.4.1
[13] RSQLite_2.3.7 AnnotationDbi_1.66.0
[15] tibble_3.2.1 fansi_1.0.6
[17] blob_1.2.4 DEoptimR_1.1-3
[19] pkgconfig_2.0.3 Matrix_1.7-0
[21] S4Vectors_0.42.0 graph_1.82.0
[23] lifecycle_1.0.4 GenomeInfoDbData_1.2.12
[25] compiler_4.4.1 Biostrings_2.72.1
[27] munsell_0.5.1 DESeq2_1.44.0
[29] codetools_0.2-20 GenomeInfoDb_1.40.1
[31] GO.db_3.19.1 pillar_1.9.0
[33] crayon_1.5.3 MASS_7.3-61
[35] BiocParallel_1.38.0 cachem_1.1.0
[37] DelayedArray_0.30.1 abind_1.4-5
[39] robustbase_0.99-3 tidyselect_1.2.1
[41] locfit_1.5-9.10 dplyr_1.1.4
[43] splines_4.4.1 fastmap_1.2.0
[45] grid_4.4.1 colorspace_2.1-0
[47] cli_3.6.3 SparseArray_1.4.8
[49] magrittr_2.0.3 S4Arrays_1.4.1
[51] survival_3.7-0 utf8_1.2.4
[53] scales_1.3.0 UCSC.utils_1.0.0
[55] bit64_4.0.5 XVector_0.44.0
[57] httr_1.4.7 matrixStats_1.3.0
[59] bit_4.0.5 png_0.1-8
[61] memoise_2.0.1 GenomicRanges_1.56.1
[63] IRanges_2.38.0 rlang_1.1.4
[65] Rcpp_1.0.12 DBI_1.2.3
[67] glue_1.7.0 bayesm_3.1-6
[69] rstudioapi_0.16.0 jsonlite_1.8.8
[71] R6_2.5.1 MatrixGenerics_1.16.0
[73] zlibbioc_1.50.0
t<-(1:9)ft <- c(1, 1, 1, 1, 1, 1, 1, 1, 1)
```output_RAIN<-rain(as.matrix(df_detr), period=24, measure.sequence=ft, deltat=6, method="independent", na.rm = TRUE)
I am not the package author, but I work on circadian biology, so my comments are general:
Periodis the expected time it takes for a gene/protein/process/what-you-measure to complete one cycle, so the time that the rhythmic curve needs to go from its highest point (the amplitude) to the lowest point and back up to the highest. For circadian genes, that is typically 24h since this represents a full light-dark cycle. But it depends on what you measure. If you for example assay seasonal gene expression over the year, and you measure in weeks, then period could be 52, as there are 52 weeks a year.Lets take one step back maybe, what exactly are you measuring, and what do you want to analyze? Please show an easy table to summarize your timepoints.