
Hello,
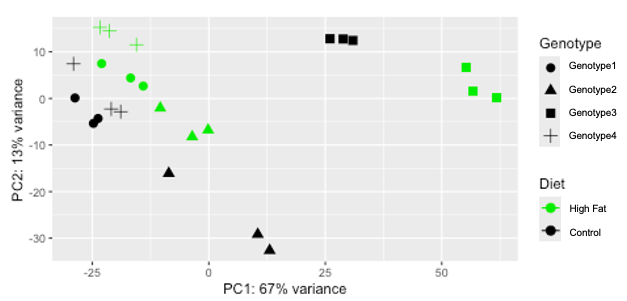
I am trying to add ellipses to each experimental group in an RNASeq data using DESeq2. In this RNASeq experiment there are 4 genotypes and 2 treatments. I transformed my data using variance stabilizing transformation (vst) as shown in the code below. I group my data on the PCA plot using Genotype(shape) and Diet(color).
PCA plot I exported
# Constructing DESeqDataSet Object
rna_exp <- DESeqDataSetFromHTSeqCount(sampleTable = sampledesc, directory = "star", design = ~ Genotype_Diet)
# Fit DESeq2 statistical model
rna_exp2 <- DESeq(rna_exp)

# vst transformation
vsd <- vst(rna_exp2)

# calculate pcaData
pcaData <- plotPCA(vsd, intgroup= c("Diet", "Genotype"), returnData=TRUE)
percentVar <- round(100 * attr(pcaData, "percentVar"))
pcaData
#                                                PC1         PC2             group    Diet  Genotype                         name
# Genotype1_Control_1                    -18.9157077  -2.8444874           Control:Genotype1    Control        Genotype1                    Genotype1_Control_1
# Genotype1_Control_2                    -20.9522176  -2.2563604           Control:Genotype1    Control        Genotype1                    Genotype1_Control_2
# Genotype1_Control_3                    -29.0537285   7.4214088           Control:Genotype1    Control        Genotype1                    Genotype1_Control_3
# Genotype1_High_Fat_1                 -21.3166182  14.4793876        High_Fat:Genotype1 High_Fat        Genotype1                 Genotype1_High_Fat_1
# Genotype1_High_Fat_2                 -15.5327726  11.5241870        High_Fat:Genotype1 High_Fat        Genotype1                 Genotype1_High_Fat_2
# Genotype1_High_Fat_3                 -23.3775377  15.2455884        High_Fat:Genotype1 High_Fat        Genotype1                 Genotype1_High_Fat_3
# Genotype2_Control_1              28.8351502  12.7642340         Control:Genotype1    Control      Genotype1             Genotype2_Control_1
# Genotype2_Control_2              26.0118887  12.8089745         Control:Genotype1    Control      Genotype1             Genotype2_Control_2
# Genotype2_Control_3              30.9264450  12.4476286         Control:Genotype1    Control      Genotype1             Genotype2_Control_3
# Genotype2_High_Fat_1           55.2383247   6.6614633      High_Fat:Genotype1 High_Fat      Genotype1          Genotype2_High_Fat_1
# Genotype2_High_Fat_2           61.7716660   0.1567968      High_Fat:Genotype1 High_Fat      Genotype1          Genotype2_High_Fat_2
# Genotype2_High_Fat_3           56.7036605   1.5576229      High_Fat:Genotype1 High_Fat      Genotype1          Genotype2_High_Fat_3
# Genotype3_Control_1             -23.7736534  -4.3032736        Control:Genotype3    Control     Genotype3             Genotype3_Control_1
# Genotype3_Control_2             -28.7286469   0.1039441        Control:Genotype3    Control     Genotype3             Genotype3_Control_2
# Genotype3_Control_3             -24.7687536  -5.3528158        Control:Genotype3    Control     Genotype3             Genotype3_Control_3
# Genotype3_High_Fat_1          -23.0104137   7.4764965     High_Fat:Genotype3 High_Fat     Genotype3          Genotype3_High_Fat_1
# Genotype3_High_Fat_2          -14.0798338   2.6576430     High_Fat:Genotype3 High_Fat     Genotype3          Genotype3_High_Fat_2
# Genotype3_High_Fat_3          -16.7878296   4.3933782     High_Fat:Genotype3 High_Fat     Genotype3          Genotype3_High_Fat_3
# Genotype4_Control_1     13.0572333 -32.6317159    Control:Genotype4    Control Genotype4    Genotype4_Control_1
# Genotype4_Control_2     10.4969905 -29.1774459    Control:Genotype4    Control Genotype4    Genotype4_Control_2
# Genotype4_Control_3     -8.5982418 -16.0843930    Control:Genotype4    Control Genotype4    Genotype4_Control_3
# Genotype4_High_Fat_1  -3.5673468  -8.2234753 High_Fat:Genotype4 High_Fat Genotype4 Genotype4_High_Fat_1
# Genotype4_High_Fat_2 -10.4241364  -2.0534517 High_Fat:Genotype4 High_Fat Genotype4 Genotype4_High_Fat_2
# Genotype4_High_Fat_3  -0.1539208  -6.7713347 High_Fat:Genotype4 High_Fat Genotype4 Genotype4_High_Fat_3

# PCA plot
png("PCA.png")
ggplot(pcaData, aes(PC1, PC2, color= Diet, shape= Genotype)) +
  geom_point(size=3) +
  xlab(paste0("PC1: ",percentVar[1],"% variance")) +
  ylab(paste0("PC2: ",percentVar[2],"% variance")) +
  coord_fixed() + scale_colour_manual(values = c(OP50 = "black", Glucose = "green2")) + stat_ellipse(type = "euclid")
dev.off()
Warning message:
I am unable to add ellipse because there are "too few points to calculate an ellipse".
Removed 8 rows containing missing values or values outside the scale range (geom_path()).
Question: Is there an alternative approach I should take to add ellipses to each genotype:Diet using the same color scheme I have?
I am interested in producing a pcaplot as shown below:
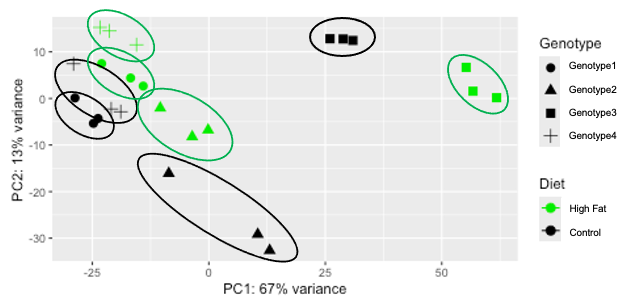
Thank you for any advice provided.
-robledoj13

Thank you for your the help @ATpoint.