Deseq2 design formula and analysis with internal controls
3
0
Entering edit mode
@kubracelikbas4-21187
Last seen 10 days ago
Turkey

Hello all,

I'm having difficulty in creating a design formula for my rna-seq experiment. I have two main groups each group has its own internal control. How can I first normalize them according to their internal control and then compare the two groups with each other?

My coldata:

enter image description here

How can I design my coldata matrix and do the comparison with deseq2?

Thank you.

DESeq2 • 1.1k views
ADD COMMENT
3
Entering edit mode
BioinfGuru ▴ 70
@yagalbi-11519
Last seen 7 hours ago
Ireland

A few questions:

  • What is the nature of the 2 controls in relation to drug-continued/withdrawed?
  • Why is every row duplicated? (replicates?)
  • What is the difference between "first" and "second"?

Assuming first/second refer to batches (i.e. there is a technical or biological difference unrelated to treatment):

  • Then you have 2 factors (make sure they are actually stored as factors): "group" with 2 levels, and "treatment" with 4 levels. The reference levels in their current order will be "first" and "control1", and will form the intercept. So the design looks like it should simply be "~ group + treatment".
  • Important: If "group" can affect "treatment" then it needs to be included as an interaction term, so then your design would be "~ group + treatment + group:treatment". For example: if instead of "group", it was "sex". Males may respond differently to treatment than females. So the design would be "~ group + treatment + sex:treatment". I hope that's clear.

If first/second are not batches (i.e just an arbitrary grouping made by you to keep control2 with drug-withdrawed):

  • It might be better to concatenate the names as "first_control1" etc. Then you have one factor (treatment) with 4 levels and the design would just be "~treatment"

This blog: A guide to designs and contrasts in DESeq2 has helped me a lot with my contrasts. Take a look at section 4 - Multiple factors multiple levels. When you get to extracting results is when you will need to take care with "deseq2::results(dds, contrast = ???)". The author also builds a contraster() function that is more intuitive, and helped me realise what I am actually comparing when using "contrast =". There is also an explanation of use of "~ 0" (as mentioned by James above) with another worked example if you choose to go that way.

If you are more mathematically minded ( I am not ) ... this might help: What is a multifactorial design with interactions and negative control experiments.

How can I first normalize them

Don't. Deseq2 will do it for you once you figure out the correct format for your metadata, design and contrasts.

ADD COMMENT
0
Entering edit mode

Thanks for the answer,

  • So one is the extended version of the other (later passage of the same control cell line), they theoretically should be the same with the first but they do not according to results. -Yes, they are duplicates. -First and second refers to groups: first group and second group.

I'll check the links thanks again.

ADD REPLY
0
Entering edit mode

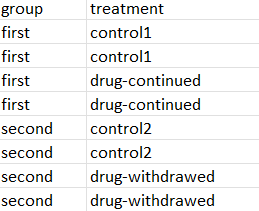
As there is a technical difference between group 1 and 2 (run time) so it is a batch.

In that case I believe this is what you are looking for: 2 controls and 2 conditions

It will be something like the following:

metadata

Assuming you have a summarized experiment object:

# re-level (check my syntax and order, you have to make sure the control in each group is used as the base-line reference)
se$treatment <- relevel(se$treatment, c("c1", "dc", "c2", "dw"))

# create dds (from summarized experiment object)
dds <- DESeqDataSet(df, design = ~group + group:treatment)

# run deseq
dse <- DESeq(dds)

# get names that can be passed inside results()
resultsNames(dse) # this is where relevel() can be checked. 

# get results:
results.group1 <- results(dds, name = "group1.treatmentdc") # compares baseline control (c1) to dc
results.group2 <- results(dds, name = "group2.treatmentdw") # compares baseline control (c2) to dw
results.group1-group2 <- results(dds, contrast = list("group2.treatmentdw","group1.treatmentdc")) # gets (dc-c1)-(dw-c2)

It may not be exactly right, but you are not too far off now. IF it were me I would be using the contraster() function of the blog post above to make sure I was comparing exactly as I thought.

ADD REPLY
0
Entering edit mode

Thank you, this was what I want.

ADD REPLY
0
Entering edit mode

I want to ask one additional question, if the two controls are the same in that case the equation becomes (dc-c1) - (dw-c1). In that scenario, since two controls are the same do they cancel out each other? If so, how can I use one control as baseline but compare my two groups (dc and dw)?

ADD REPLY
0
Entering edit mode

First, the 2 controls are different because they were run at different time points. However, if they were hypothetically identical, then there would be only 1 control (as you call it "c1"). Then it would be (dc-c1) - (dw-c1) as you suggest. So in an equation: yes they cancel each other. But that does not mean nothing happened, it means the same thing was subtracted from both.

EDIT: This following paragraph is not right, thanks James: - Mathematically, this is what is happening: Consider 2 fruit bags, both contain apples (treatment) and oranges (control). I don't care about the total number in each bag, only the number of apples. So bag1-bag2 (or dc-dw) is not what I want, unless I first remove the oranges (dc-c1)-(dw-c1). Ridiculous example I know, but it's friday!

I find it easier to conceptualise interactions not as equations but as "difference between differences":

results.group1 <- results(dds, name = "group1.treatmentdc") # difference between c1 and dc
results.group2 <- results(dds, name = "group2.treatmentdw") # difference between c2 and dc
results.group1-group2 <- results(dds, contrast = list("group2.treatmentdw","group1.treatmentdc")) # difference between differences

How can I use one control as baseline but compare my two groups (dc and dw)?

  • Take a look at this blog. See section: 2 One experimental condition, three levels. This is a classic case when you have a control group and two treatment groups.
ADD REPLY
0
Entering edit mode

Thanks a lot !!!

ADD REPLY
0
Entering edit mode

Mathematically it doesn't matter if you remove the oranges or not. Say there are 8 apples in one bag and 3 in the other. The difference will be 5 no matter how many oranges are in the bags, because it's the same number of oranges! That's what it means to say they cancel each other out. In other words, dc - dw is exactly what you want because it's identical to (dc - c1) - (dw - c1), for any value of c1.

ADD REPLY
1
Entering edit mode

Yup.

If a = (x+c), and b = (y+c), find x-y
-c = x-a = y-b
x-y = a-b

So that means there is no need for an interaction term in the design for this scenario of 2 conditions + 1 control.

design(dds) <- ~ treatment

Thanks James, so easy to go wrong with this.

ADD REPLY
0
Entering edit mode

If there are 4 +- 2.0 oranges in the control bag and 8 +- 0.5 in bag 1 and 3 +- 0.2 in bag2, and you are trying to compare bag 1 to the control bag, and then bag 2 to the control bag, and then want to compare the comparisons, you've got a huge headache on your hands would not have had if you had just compared bag 1 to bag 2.

Adding in the inherent uncertainty of the controls makes things worse.

ADD REPLY
2
Entering edit mode
@james-w-macdonald-5106
Last seen 3 hours ago
United States

You are asking about an interaction term, which is (drug-continued - control1) - (drug-withdrawed - control2), which assumes that there are actual differences between the two control samples. If the two controls are essentially the same thing, they cancel out and then it's just drug-continued - drug-withdrawed.

There's probably a more automatic way of doing this, but I don't totally get how DESeq2 does the contrasts, so I do it the dumb direct way. As a fake example

> dds <- makeExampleDESeqDataSet()
> design(dds)
~condition
> colData(dds)
DataFrame with 12 rows and 1 column
         condition
          <factor>
sample1          A
sample2          A
sample3          A
sample4          A
sample5          A
...            ...
sample8          B
sample9          B
sample10         B
sample11         B
sample12         B

## change this to have four levels

> colData(dds) <- DataFrame(condition = factor(rep(LETTERS[1:4], each = 3)))
> colData(dds)
DataFrame with 12 rows and 1 column
    condition
     <factor>
1           A
2           A
3           A
4           B
5           B
...       ...
8           C
9           C
10          D
11          D
12          D

## and change to a cell means model, which isn't totally necessary, but maybe easier to understand

> design(dds) <- ~ 0 + condition
> design(dds)
~0 + condition
> dds <- DESeq(dds)
estimating size factors
estimating dispersions
gene-wise dispersion estimates
mean-dispersion relationship
final dispersion estimates
fitting model and testing

## the signs in the interaction term I described above, after 
## distributing into the parentheses are 1, -1, -1, 1
## so we use that as the contrast

> results(dds, c(1, -1, -1, 1))
log2 fold change (MLE): +1,-1,-1,+1 
Wald test p-value: +1,-1,-1,+1 
DataFrame with 1000 rows and 6 columns
          baseMean log2FoldChange
         <numeric>      <numeric>
gene1     88.17007       0.895912
gene2     11.37401       0.267528
gene3     10.31525      -3.993132
gene4      2.00921       0.069651
gene5     18.40443      -0.322246
...            ...            ...
gene996    13.0700       1.448528
gene997    14.3798       0.200951
gene998    79.2857      -0.550139
gene999    16.5750      -0.014954
gene1000   14.8213      -2.309181
             lfcSE       stat
         <numeric>  <numeric>
gene1     0.592058  1.5132152
gene2     1.463057  0.1828555
gene3     1.442082 -2.7690057
gene4     2.609663  0.0266897
gene5     1.069997 -0.3011655
...            ...        ...
gene996   0.992003  1.4602058
gene997   1.149728  0.1747813
gene998   0.633383 -0.8685729
gene999   1.124772 -0.0132952
gene1000  1.049954 -2.1993176
             pvalue      padj
          <numeric> <numeric>
gene1    0.13022500  0.852226
gene2    0.85491143  0.998859
gene3    0.00562277  0.763831
gene4    0.97870726  0.998859
gene5    0.76328833  0.998859
...             ...       ...
gene996   0.1442335  0.852768
gene997   0.8612515  0.998859
gene998   0.3850808  0.979411
gene999   0.9893923  0.998859
gene1000  0.0278553  0.763831
0
Entering edit mode

Thanks a lot.

ADD REPLY
1
Entering edit mode
swbarnes2 ★ 1.4k
@swbarnes2-14086
Last seen 5 minutes ago
San Diego

How can I first normalize them according to their internal control

That's generally not how it's done. You compare the two groups you want, and see what genes are different. If you want to know differences between drug_continued and drug_stopped, compare them to each other. Don't add the complication of variability and uncertainty from a third set of samples.

ADD COMMENT
0
Entering edit mode

But I want to see if the difference between drug_continued and drug_stopped are specific to them and not observed between control and drug_continued.

ADD REPLY
0
Entering edit mode

It sounds like the experiment should have had a Day0 with no treatment, Day 5 after 5 days of treatment, and then a Day 10 after 10 days of treatment, and Day 10 when treatment stopped on Day 8. Something like that.

But I guess you want an interaction, where you want to see if the gene change between stopped and its control is different from the gene change between continued and its control.

ADD REPLY

Login before adding your answer.

Traffic: 549 users visited in the last hour
Help About
FAQ
Access RSS
API
Stats

Use of this site constitutes acceptance of our User Agreement and Privacy Policy.

Powered by the version 2.3.6