Entering edit mode

Novice here, this was a warning that I came across while running fgsea, which resulted in the final GSEA plot missing some bars.
my question is, how best should i "normalize" my log2FC statistic so the distribution would not cause such warnings
2: In fgseaMultilevel(fgsea_sets, stats = ranks.combined.pari.old, : There were 17 pathways for which P-values were not calculated properly due to unbalanced (positive and negative) gene-level statistic values. For such pathways pval, padj, NES, log2err are set to NA. You can try to increase the value of the argument nPermSimple (for example set it nPermSimple = 10000000)
FYI i did hist(data$avgLog2FC) and it looks like the attached picture if that helps. Much thanks in advance!
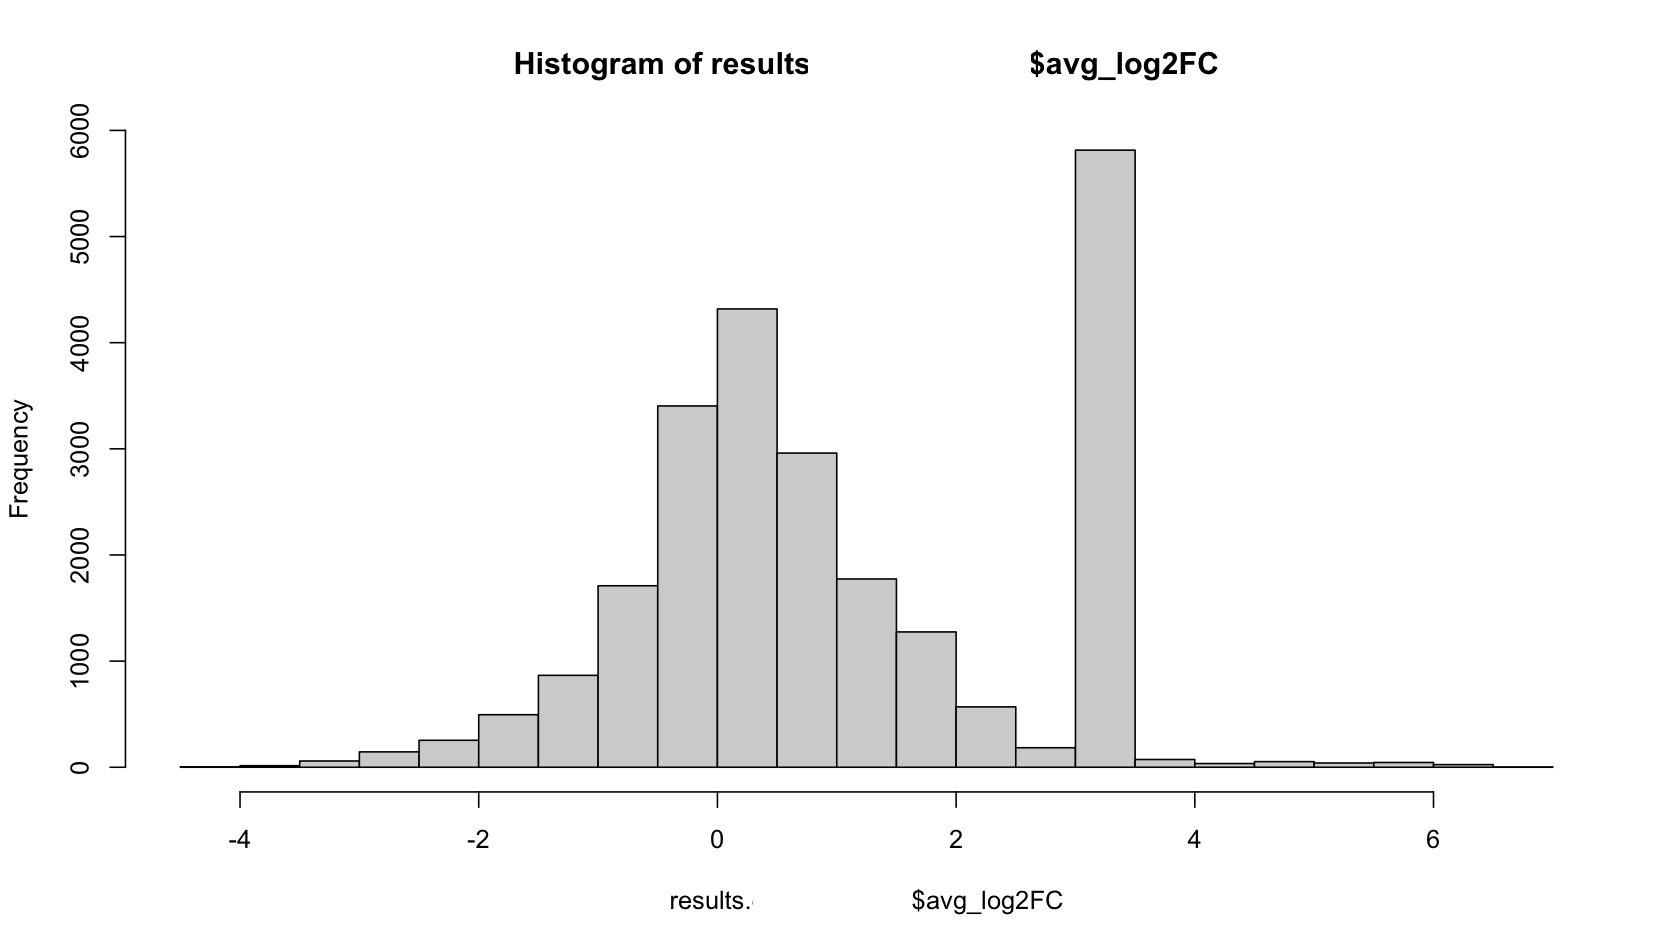
You have somewhere around 6000 genes with a logFC between 3 - 3.5? That seems .... odd.
Hi James, thanks for your time! It seems that the peak near 3.5 are genes with pct 1 and 2 as 0 (and could be easily fixed by the FindMarkers argument min.pct = 0.01). Out of curiosity, why would the avg_log2FC still have a value? I used MAST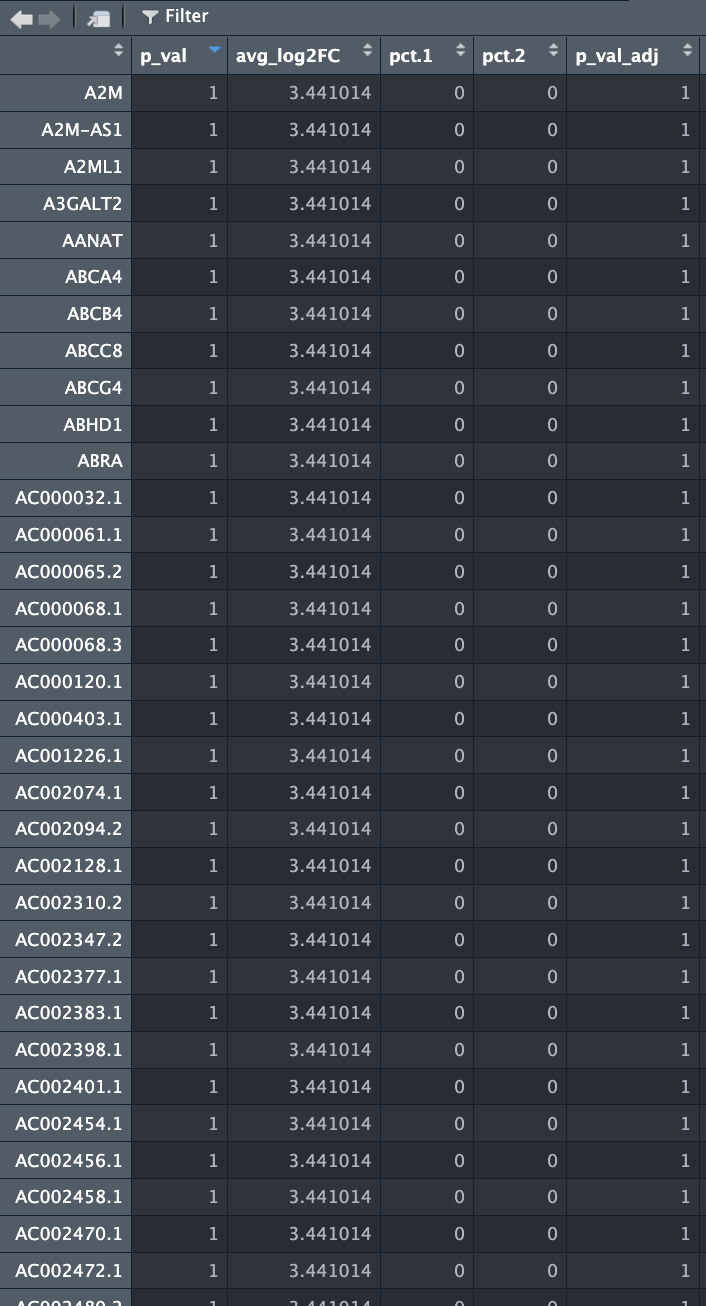
I am not familiar with
MAST, so cannot say why. But filtering seems appropriate.This could be artifact from zeroes/pseudocounts. Could be large difference in sequencing depth and read counts per cell between the populations. Anyway, yes, it's not a good ranking distribution.