
Hi all,
I have a dataset of 23 bulk rna-seq samples for differential expression analysis. Using both RUVs and RUVr I have produced the following images to assess/mitigate unwanted technical variation. the k-values are 18 (RUVs) and 15 (RUVr) before I get any clustering by variable of interest, and even then the RLE plot still shows evidence of technical variation present.
I'm really not sure what to do here. There is no other batch effect I can account for. My next idea is to try SVA, but I imagine there won't be much of a difference. I could also separate out the single variable "trial_condition" to 2 variables "trial" and "condition"... but again, I don't see it making much of a difference.
Any advice is appreciated, I'm really not sure how to proceed.
Regards
Kenneth
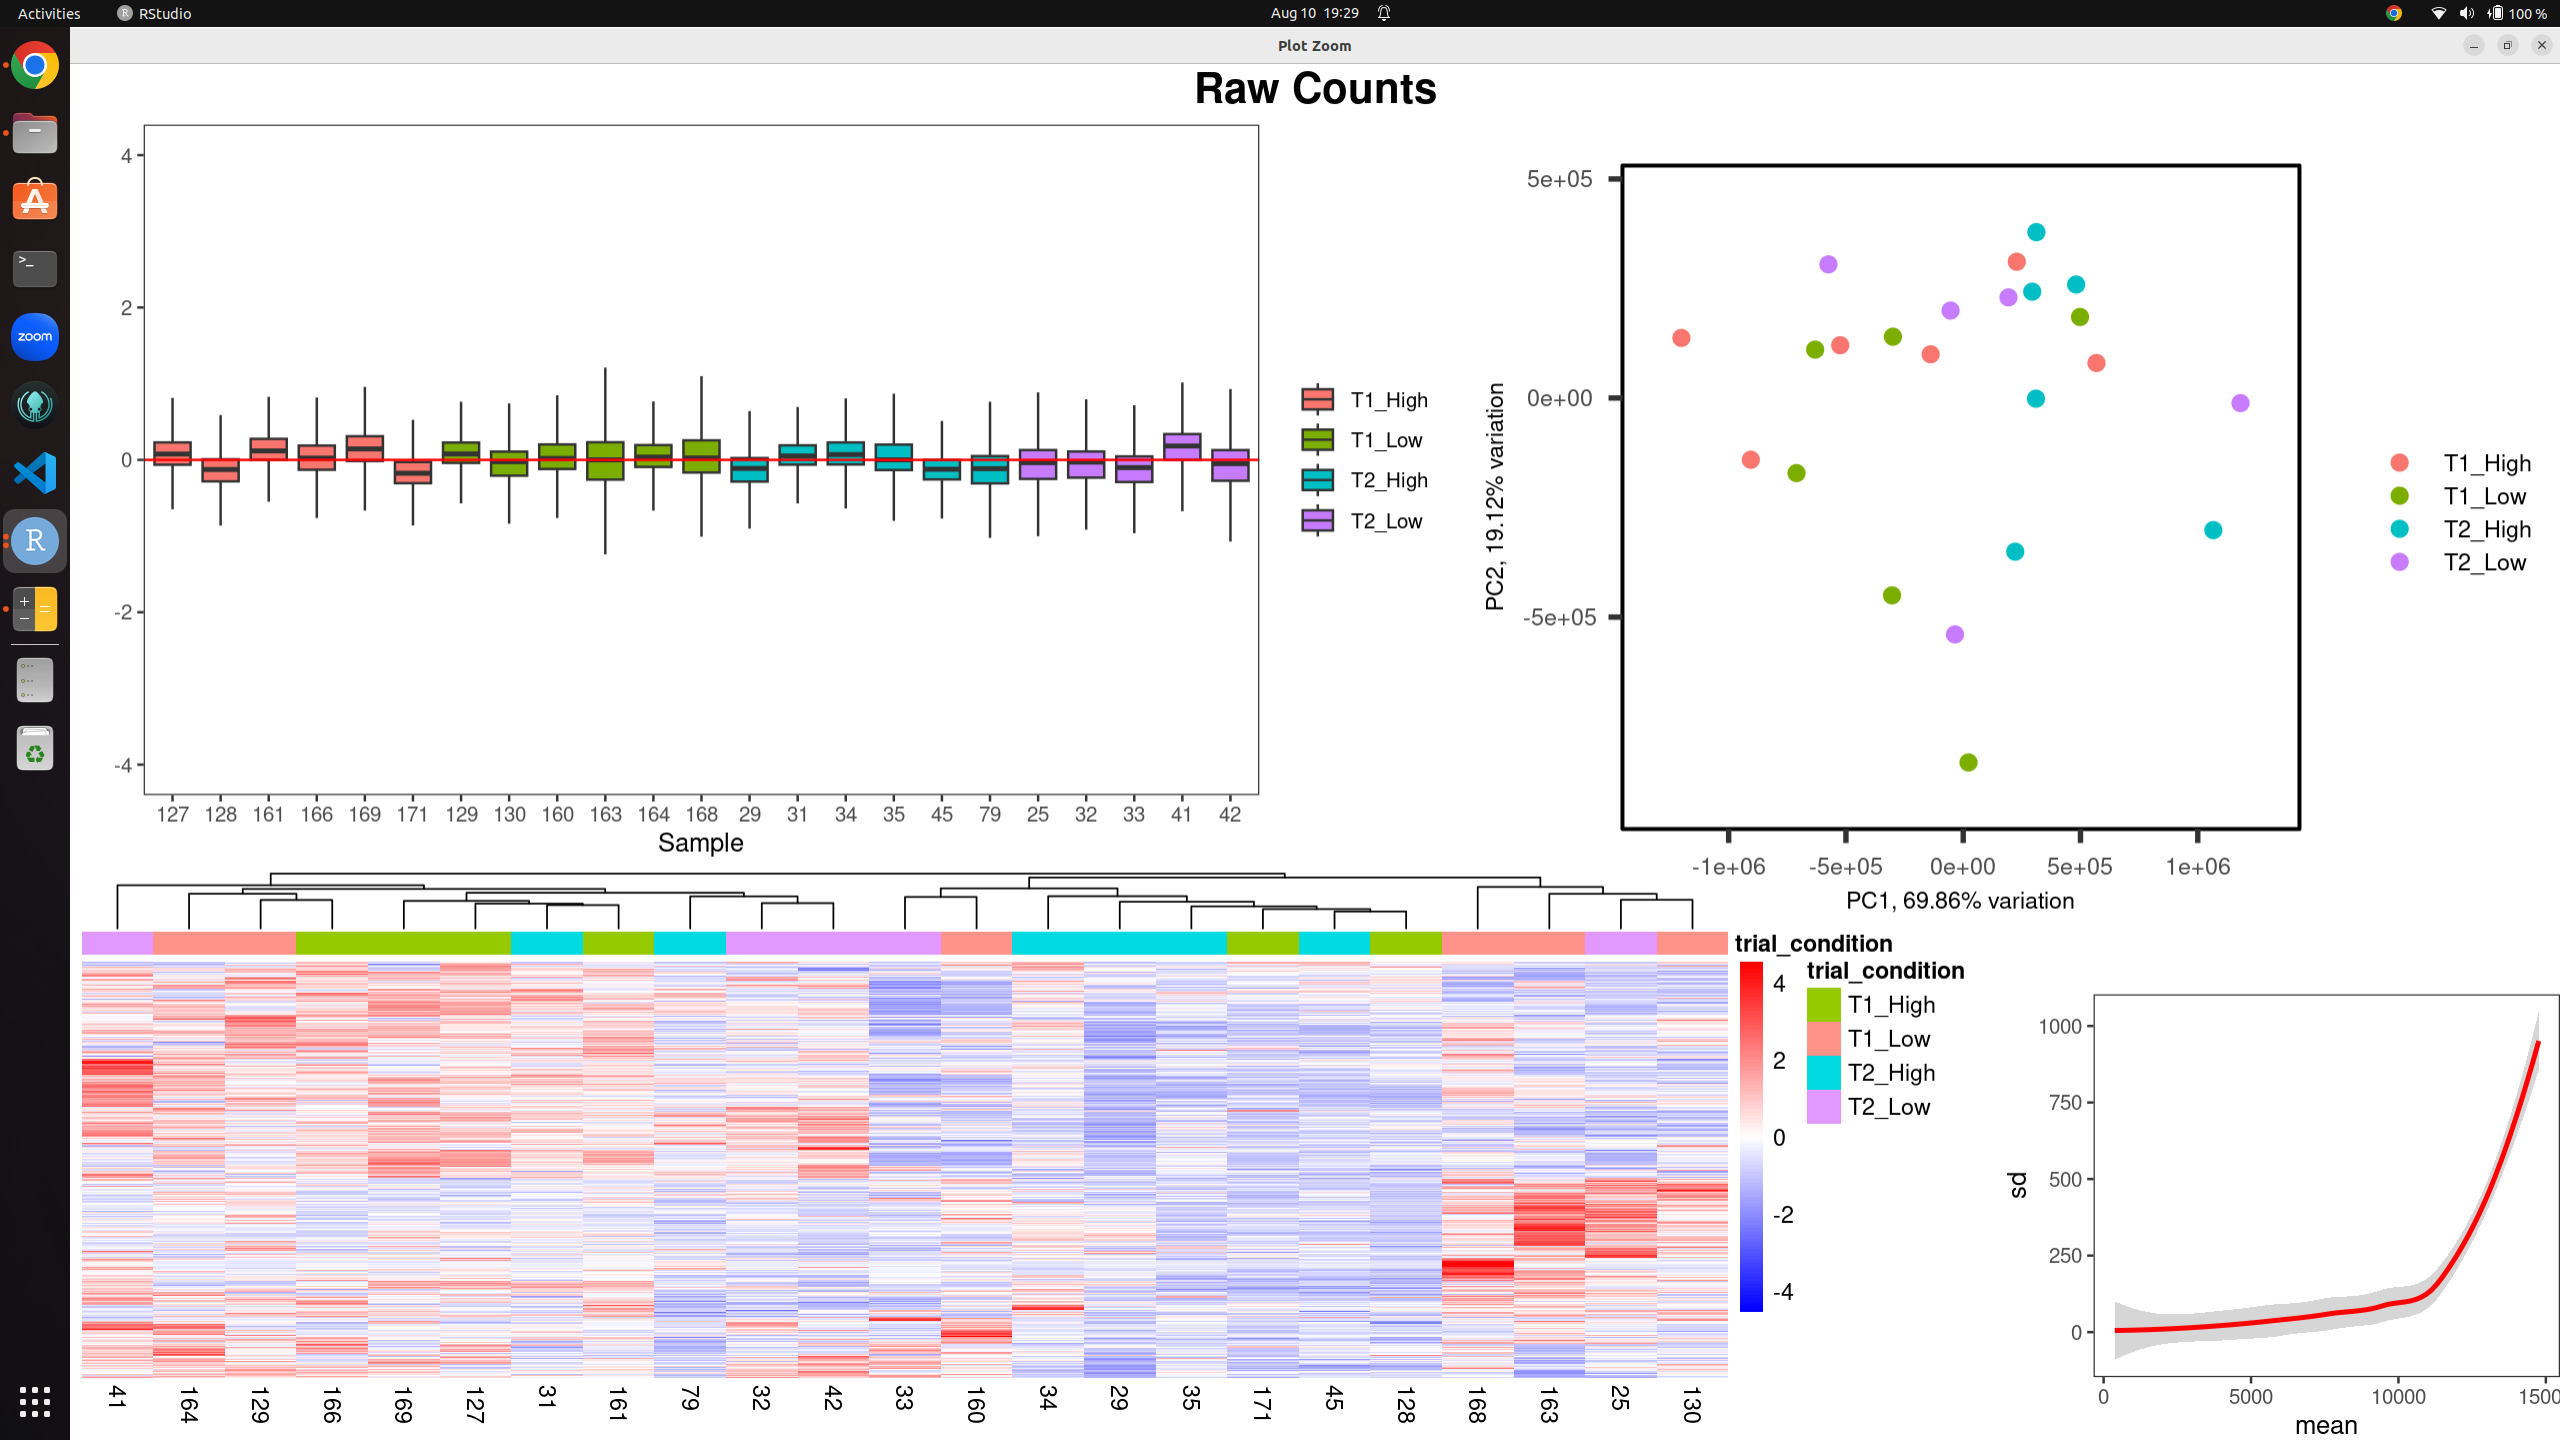
Raw counts without RUV:
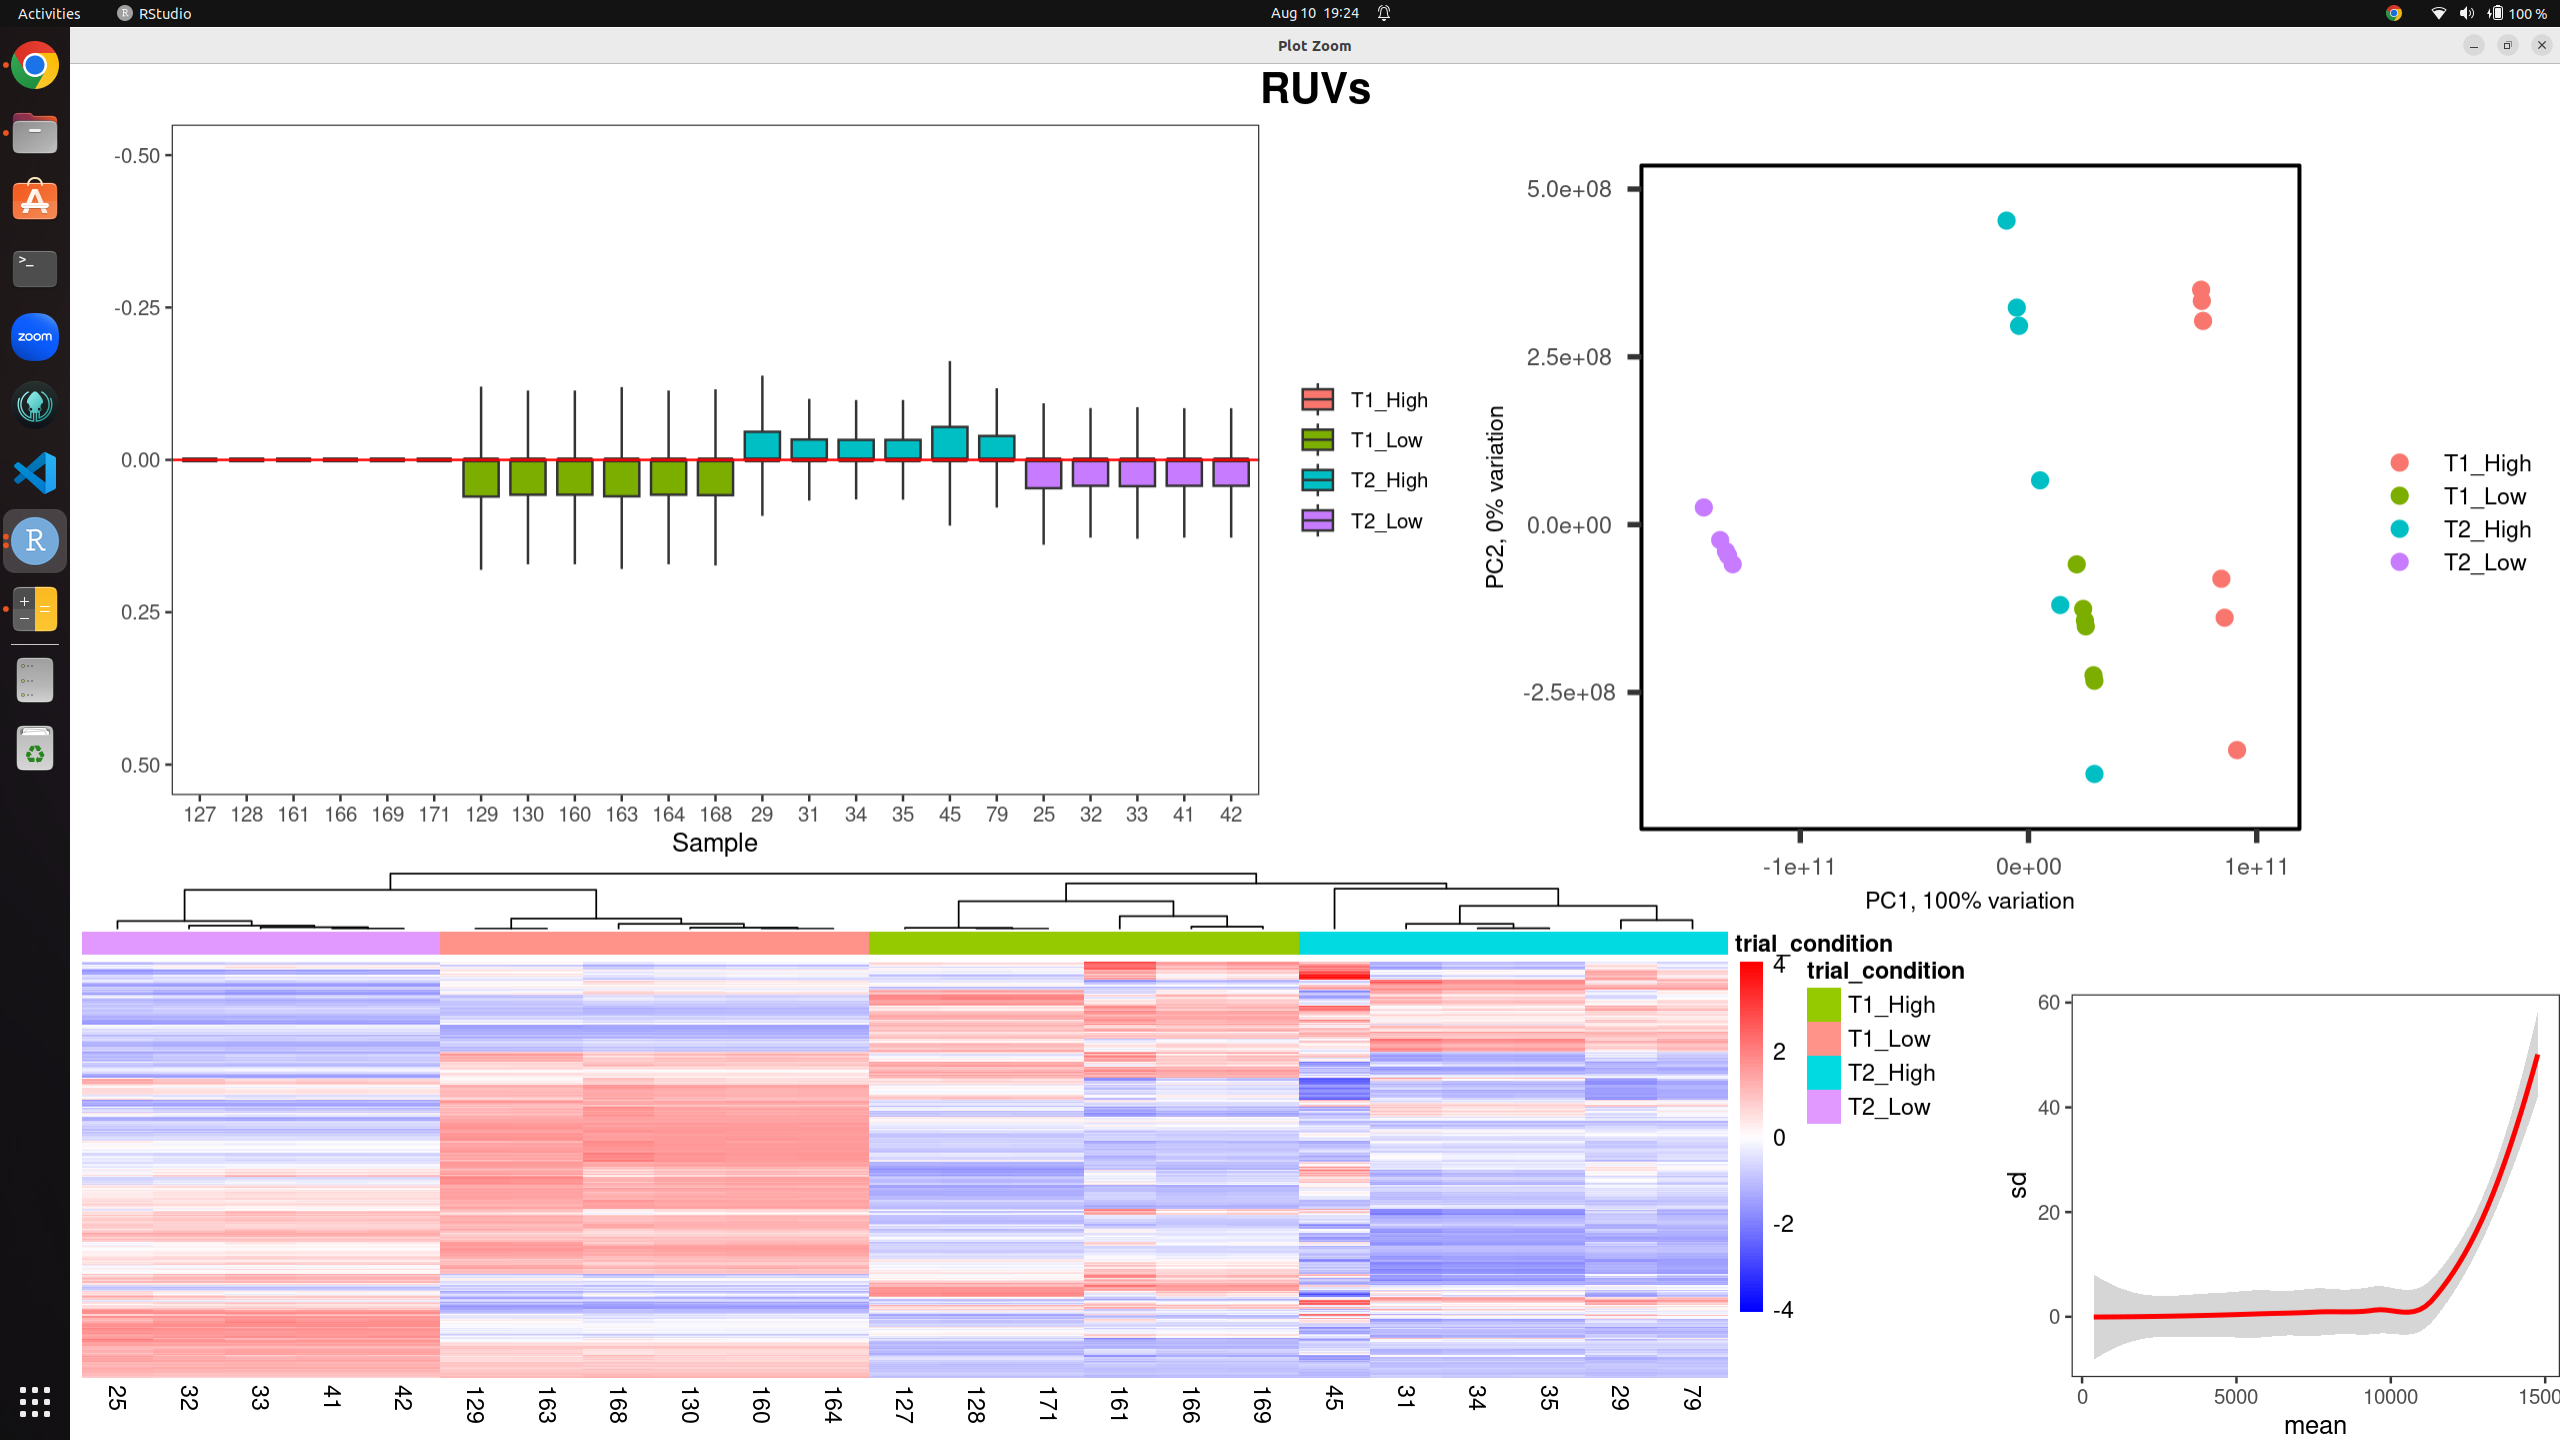
Raw counts with RUVs:
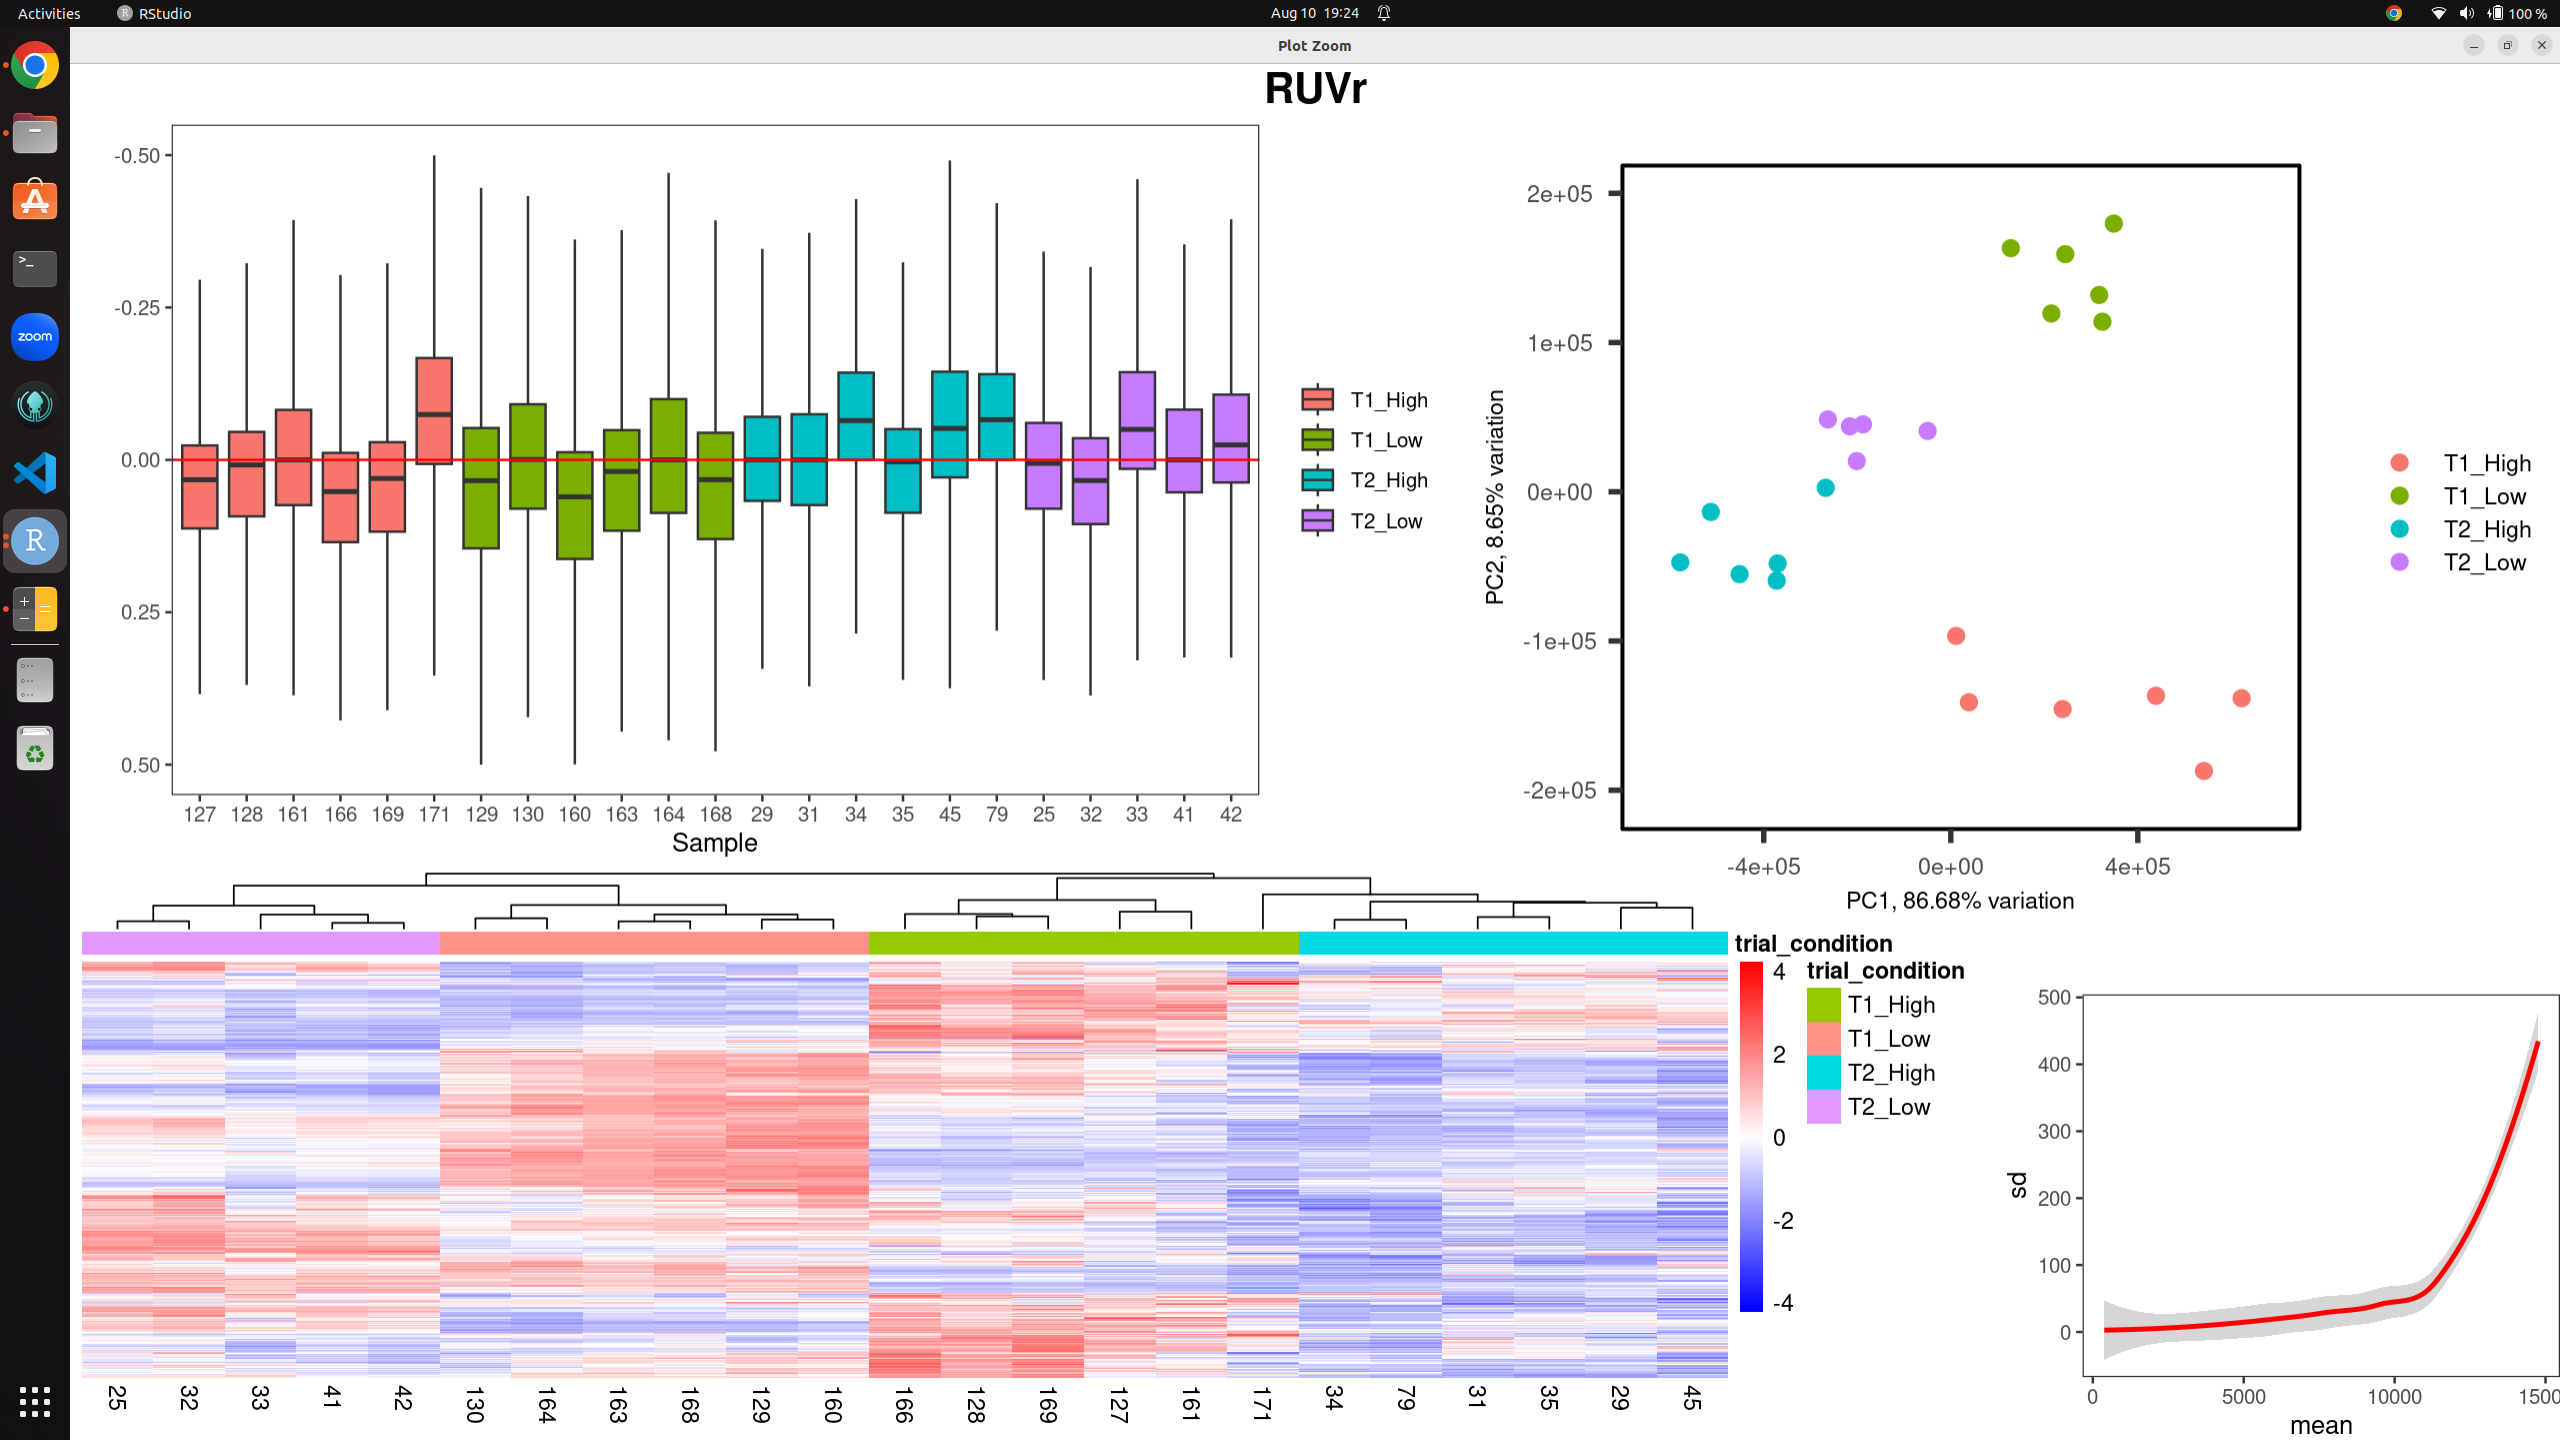
Raw counts with RUVr:

I knew I had something wrong. I realise now that in all the examples I've seen of RUV/SVA they all start with data that already shows a treatment effect but 1 or 2 samples are not clustering as expected. This makes much more sense now. Thank you for your assessment and explanation.
Hi Gordon (or anyone),
As a sanity check of my understanding of the appropriate use of RUV with the following 2 images of data from a different tissue. Is this another example of artificially separating the groups? Where do I choose to stop increasing the k value (and how long is a piece of string)?
1) When k is set to 1, the use of RUVr and SVA show an improvement in clustering of expected groups, and the only obvious RLE plot changes are the box sizes and whiskers of T1. When k = 3, T1 and T2 are separated by PC1
2) When k is set to 9, for the first time one of the plots (SVA) clusters the 4 groups separately, and the RLE plot shows more uniform box sizes.