Size factor normalized counts for between sample comparisons - correct?
1
0
Entering edit mode
boczniak767 ▴ 740
@maciej-jonczyk-3945
Last seen 4 weeks ago
Poland

Hi,

I'd like to find stably expressed genes in RNA-seq projects.

I assumed that for each project I can compute between-sample (not necessarily between-genes) comparable expression values and judge stable expressin by coefficient of variation.

From what I was read I understand FPKM is not ok here and I could use CPM or TPM or DESeq2 median of ratios as stated at hbctraining.

As I've used DESeq2 previously the last option seems optimal for me. Also as I've read TPM calculation from counts is only approximation as stated by Michael Love and I don't have fastq files anymore (due to disk space constrains) so I can't use Salmon or similar program to calculate TPM. Theoretically I could download fastq files again and process them but I use many projects so I think it is not time-efficient now.

So can I normalize counts with counts(dds, normalized=T) (to get 'median of ratios' normalized values) and compute coefficient of variation of these values to get ranking of non-DE genes?

Alternatively, could I use CPM values obtained from edgeR for example?

DESeq2 • 781 views
ADD COMMENT
1
Entering edit mode

I'd like to find stably expressed genes in RNA-seq projects.

They I'd use the 'lessAbs' test from DESeq2, see vignette, which can identify non-DE genes by significance.

and I don't have fastq files anymore

But they still exist somewhere, no? Otherwise it will be hard to publish.

Alternatively, could I use CPM values obtained from edgeR for example?
The normalization methods of DESeq2 and edgeR perform very similar, it really does not matter. Use either of the two, but not a method like RPKM or TPM that only corrects for library size, but not composition.

ADD REPLY
0
Entering edit mode

Thank you for input. In fact I've tried lessAbs in DESeq2 but even for lfcThreshold=.5 it haven't detected any significant non-DE genes. So far I've tried it with project containing only two reps per condition, so maybe for other projects with more replication it would be okay.

The normalization methods of DESeq2 and edgeR perform very similar, it really does not matter. Use either of the two, but not a method like RPKM or TPM that only corrects for library size, but not composition.

Thank you, so I'll try with size factor normalization from DESeq2.

ADD REPLY
1
Entering edit mode

The test is afaik and by experience quite conservative, so maybe be a bit more lenient, either for lfcThreshold (for example in one project I used FC=1.75 and padj 0.1). Test all possible combinations of your groups, and then intersect. Use what is common. Something like that. Depending on what your goal is this might just be "good enough".

ADD REPLY
0
Entering edit mode

Thanks for suggestion. In each project I have two factors genotype and treatment. I'd like to find stable expressed genes in each projects. So I neglected genotype and tested treated vs control.

FC=1.75 and padj 0.1 don't sound good for me so I'll try to use CV of normalized counts.

ADD REPLY
0
Entering edit mode

Michael Love what are your thoughts about it?

ADD REPLY
1
Entering edit mode
@mikelove
Last seen 6 days ago
United States

I would use VST here, and look at row variance. See the RNA-seq gene-level workflow for example.

ADD COMMENT
0
Entering edit mode

Thank you for response. I'll use VST and as I have already 'median of ratios' normalized counts I'll compare both approaches.

See the RNA-seq gene-level workflow for example.

Do you mean this section?

ADD REPLY
0
Entering edit mode

yes, that section

ADD REPLY
0
Entering edit mode

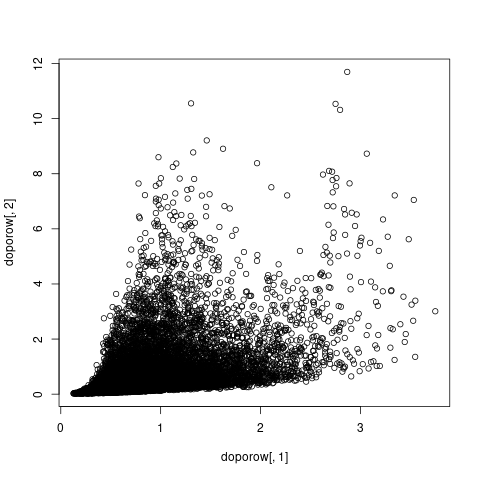
Okay, so I've tried both metods. 'median of ratios' + CV vs VSD + variance. Forgive me if it is stupid but to compare these two methods I computed correlation.

Depending on method it is only 0.49 (Pearson) or 0.68 (Spearman) what looks not very good. Maybe I should expect that but I wanted to share this with you - in the end I'll follow your suggestion Michael Love

For completness: here is filtered dds, I've used following filtering

keep <- rowSums(counts(dds) >= 10) >= 3
dds.f <- dds[keep,]

And this is my code

# 'median of ratios' + CV
cts.f.norm=counts(dds.f, normalized=T)
coeff.var=apply(cts.f.norm, 1, function(x) sd(x) / mean(x))

# VSD + variance
vsd <- varianceStabilizingTransformation(dds.f, blind = FALSE)
# extract count matrix
counts.vst=assay(vsd)
# compute variance
counts.vst.var=apply(counts.vst, 1, var)

# correlation and plot
doporow=cbind(coeff.var, counts.vst.var)
cor(doporow[,1], doporow[,2])
[1] 0.4912124
# Spearman correlation
cor(doporow[,1], doporow[,2], method = 'spearman')
[1] 0.6872288

# plot
plot(doporow[,1], doporow[,2])

And this is the plot

enter image description here

ADD REPLY
1
Entering edit mode

The reason i don't prefer SD/mean is that SD is noisy especially when counts are low. So you can get a large value from small count genes just by sampling variation.

As we explain in the vignette, this is not a property of VST data and variance calculated from it.

ADD REPLY
0
Entering edit mode

Thank you Michael Love and ATpoint for help :-)

ADD REPLY

Login before adding your answer.

Traffic: 800 users visited in the last hour
Help About
FAQ
Access RSS
API
Stats

Use of this site constitutes acceptance of our User Agreement and Privacy Policy.

Powered by the version 2.3.6