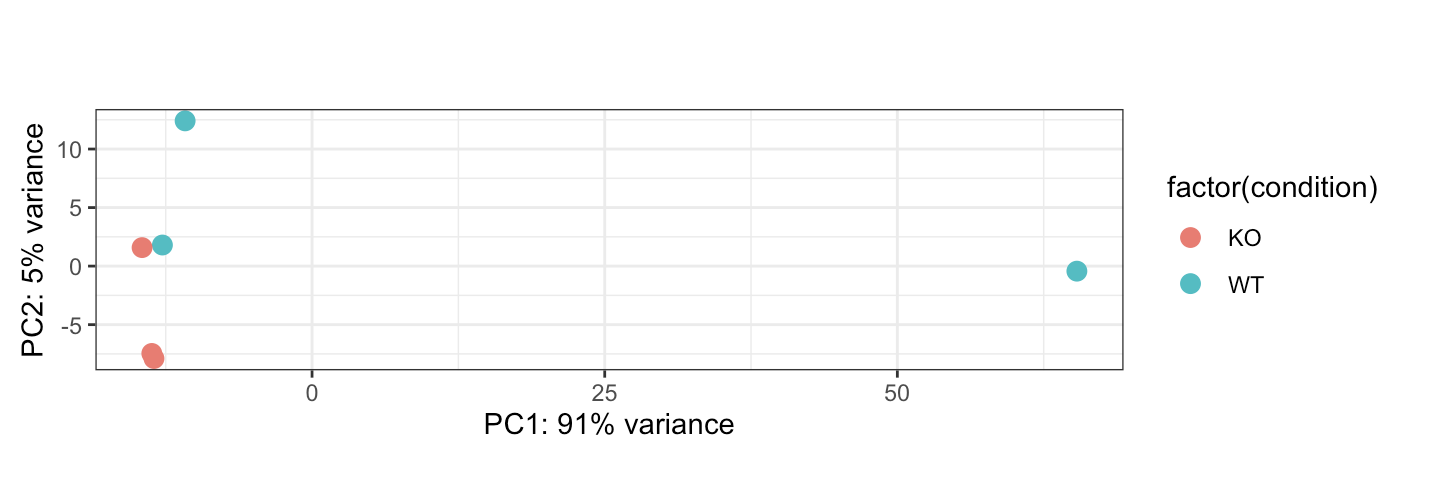
I am currently using Deseq2 for RNA seq analysis. I have two groups with three biological replicates w/ a control and KO mouse line. Here is what the PCA plot currently looks like 
Code should be placed in three backticks as shown below
CT2_dds <- DESeqDataSetFromMatrix(countData = countData_2, colData = colData_2, design = ~ condition)
keep_2 <- rowSums(counts(CT2_dds)) >= 10
CT2_dds  <- CT2_dds[keep_2,]

CT2_dds <- DESeq(CT2_dds)

CT2_res <- results(CT2_dds, alpha = 0.05)


# include your problematic code here with any corresponding output
# please also include the results of running the following in an R session

sessionInfo( )

