I am using the package sesame to do a differential methylation analysis on a set of tumors with and without a particular condition.
se <- SummarizedExperiment(betas, colData = metaData)
colData(se)$condition <- relevel(factor(colData(se)$EBV), "Positive")
summary = DML(se, ~condition, BPPARAM = BiocParallel::MulticoreParam(4))
test_result = summaryExtractTest(summary)
and then I test for gene enrichment:
df <- testResult[testResult$Pval_Condition < 0.01 & testResult$Eff_Condition > 0.1,]
result <- testEnrichment(df$Probe_ID, KYCG_buildGeneDBs(df$Probe_ID, max_distance=100000, platform="EPIC"),platform="EPIC")
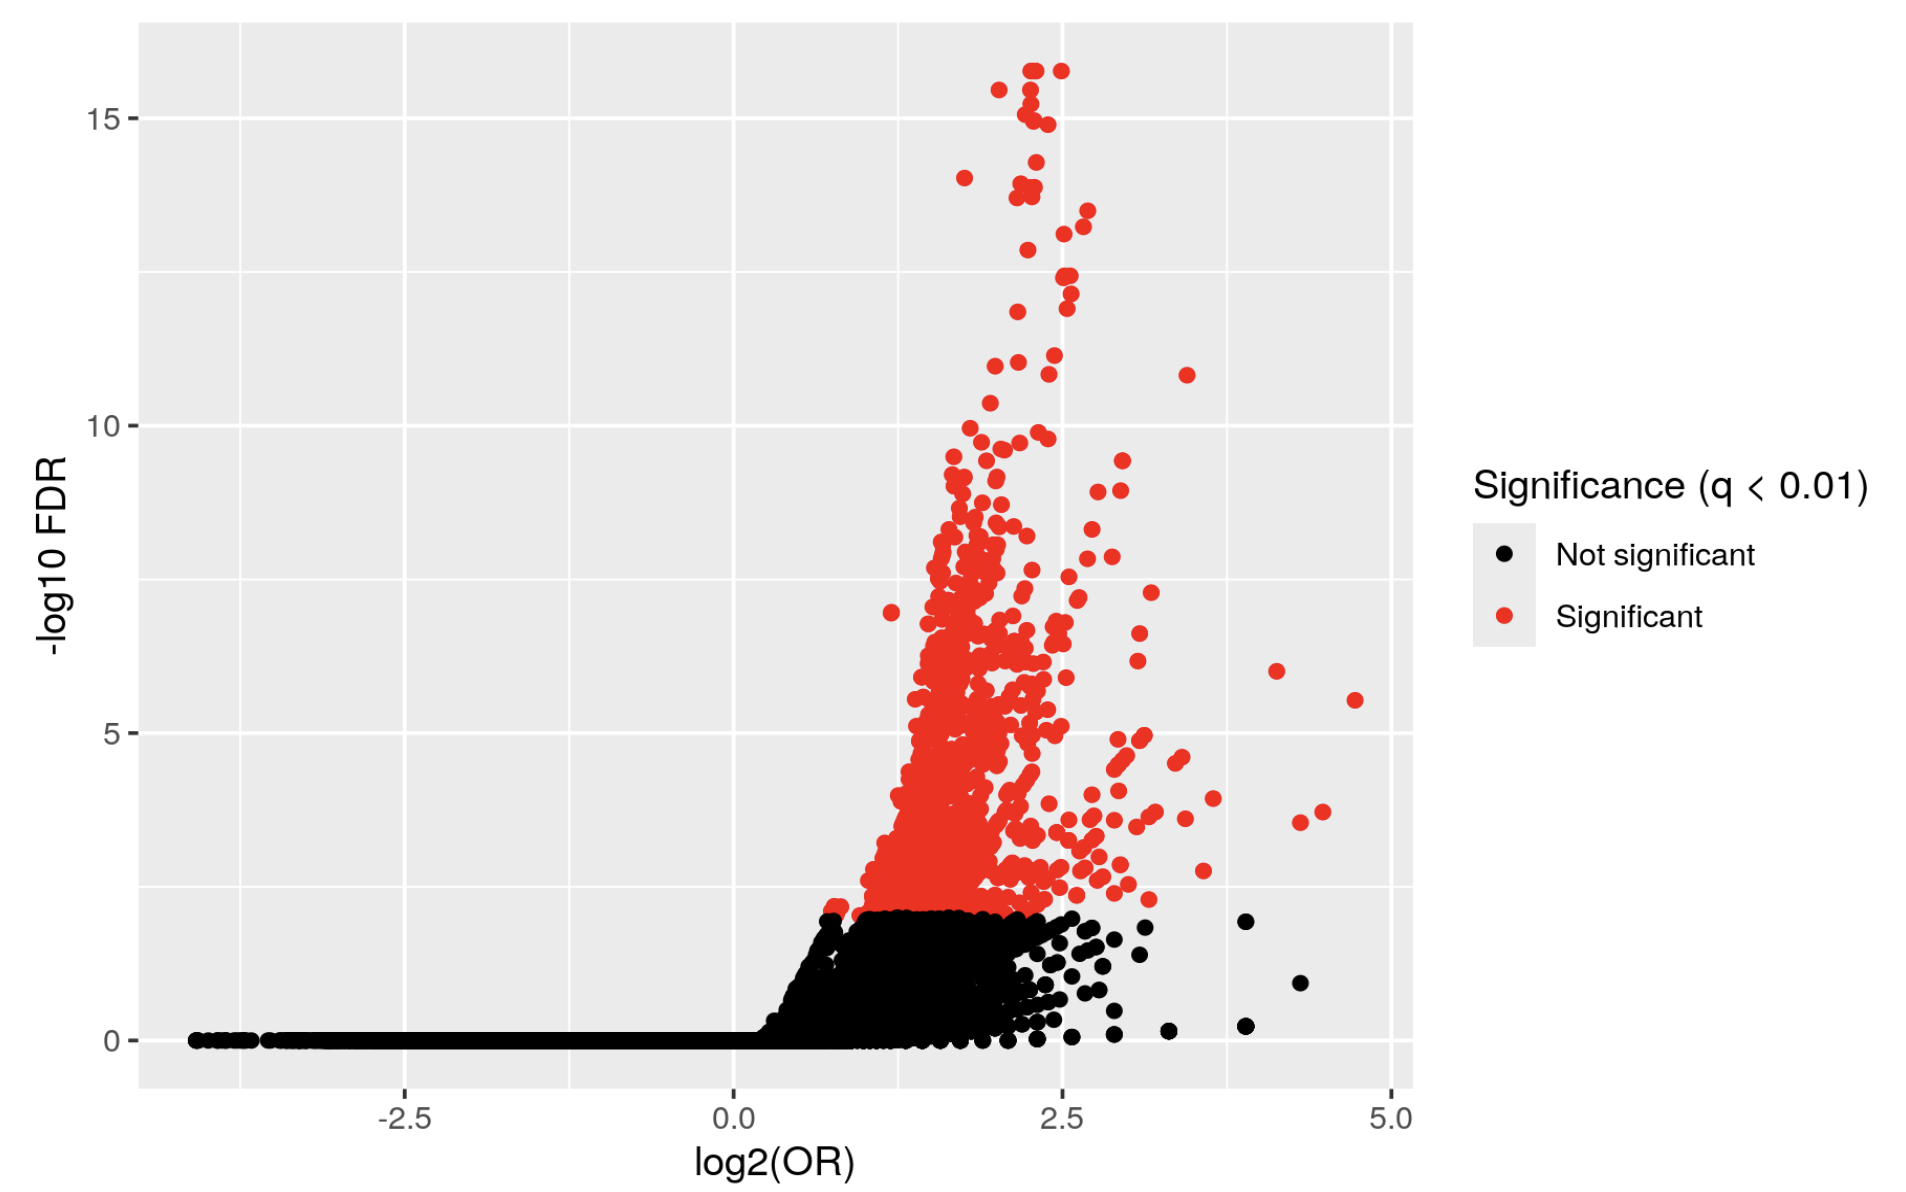
but I get a volcano plot like this:
KYCG_plotVolcano(results,label_by="gene_name",alpha=0.01)
Which doesn't really make sense. I actually inverted the condition
colData(se)$condition <- relevel(factor(colData(se)$EBV), "Negative")
and I get a similar graph, whereas if the first one were true, I think the graph would be inverted.
What am I missing? where is the other half of the volcano???!!!
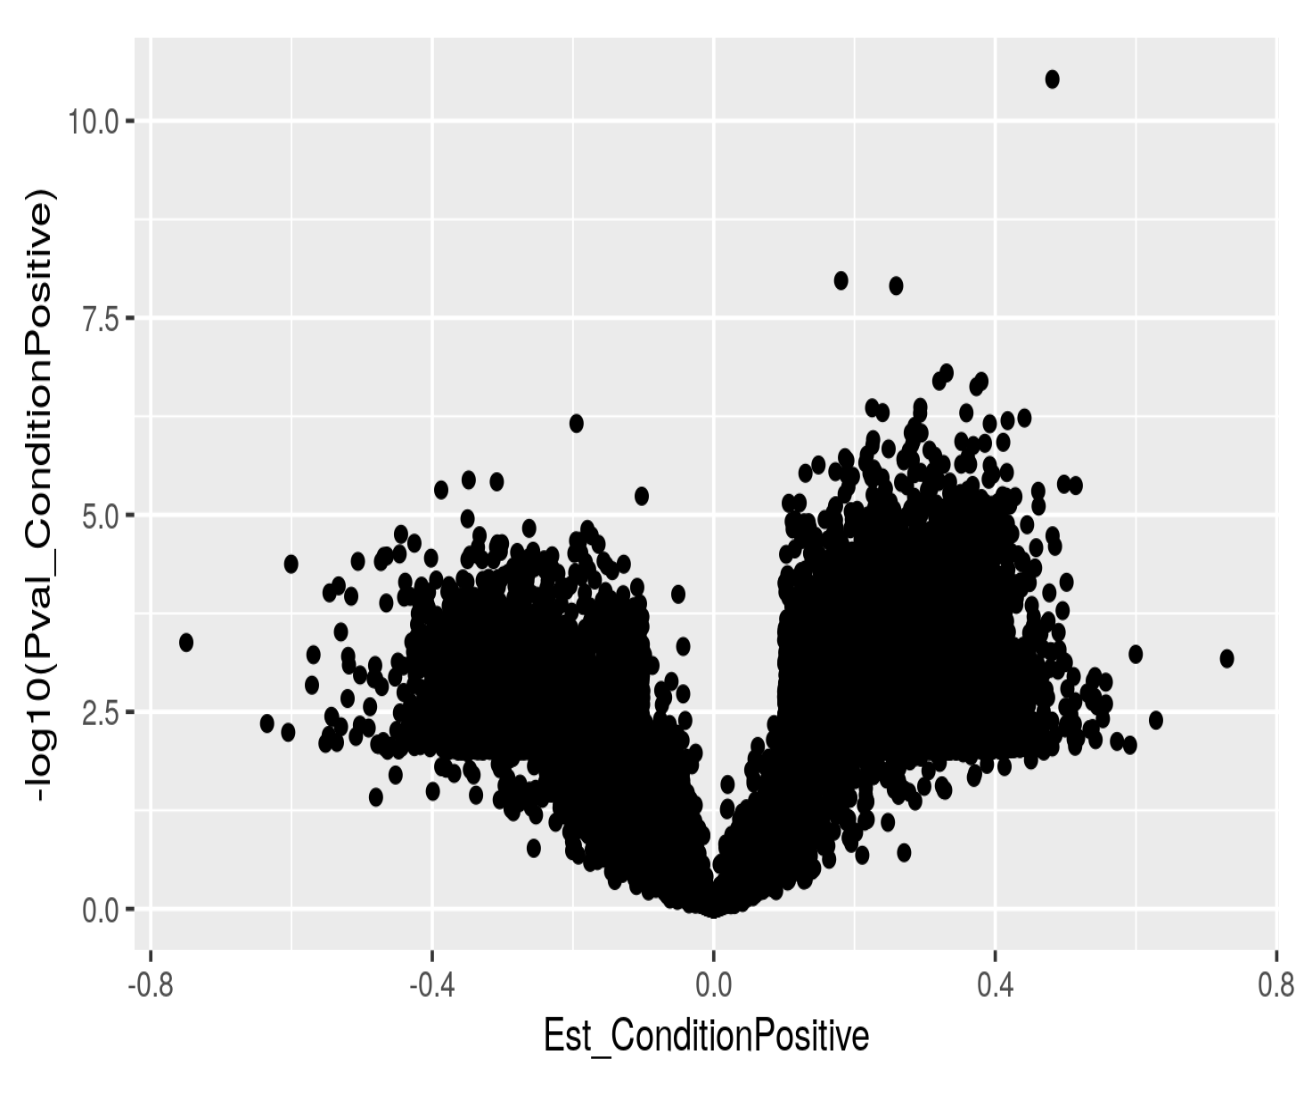
If I just plot log10 pvalues as a function of effect size I do get what I would expect:
One idea is that the enrichment by gene does not relate to the "direction", and hence I would need to do the analysis separately:
dfUp <- testResult[testResult$Pval_Condition < 0.01 & testResult$Eff_Condition > 0.1 & testResult$Est_Condition>0,]
resultUp <- testEnrichment(dfUp$Probe_ID, KYCG_buildGeneDBs(dfUp$Probe_ID, max_distance=100000, platform="EPIC"),platform="EPIC")

dfDown <- testResult[testResult$Pval_Condition < 0.01 & testResult$Eff_Condition > 0.1 & testResult$Est_Condition<0,]
resultDown <- testEnrichment(dfDown$Probe_ID, KYCG_buildGeneDBs(dfDown$Probe_ID, max_distance=100000, platform="EPIC"),platform="EPIC")
Any suggestions appreciated!!!

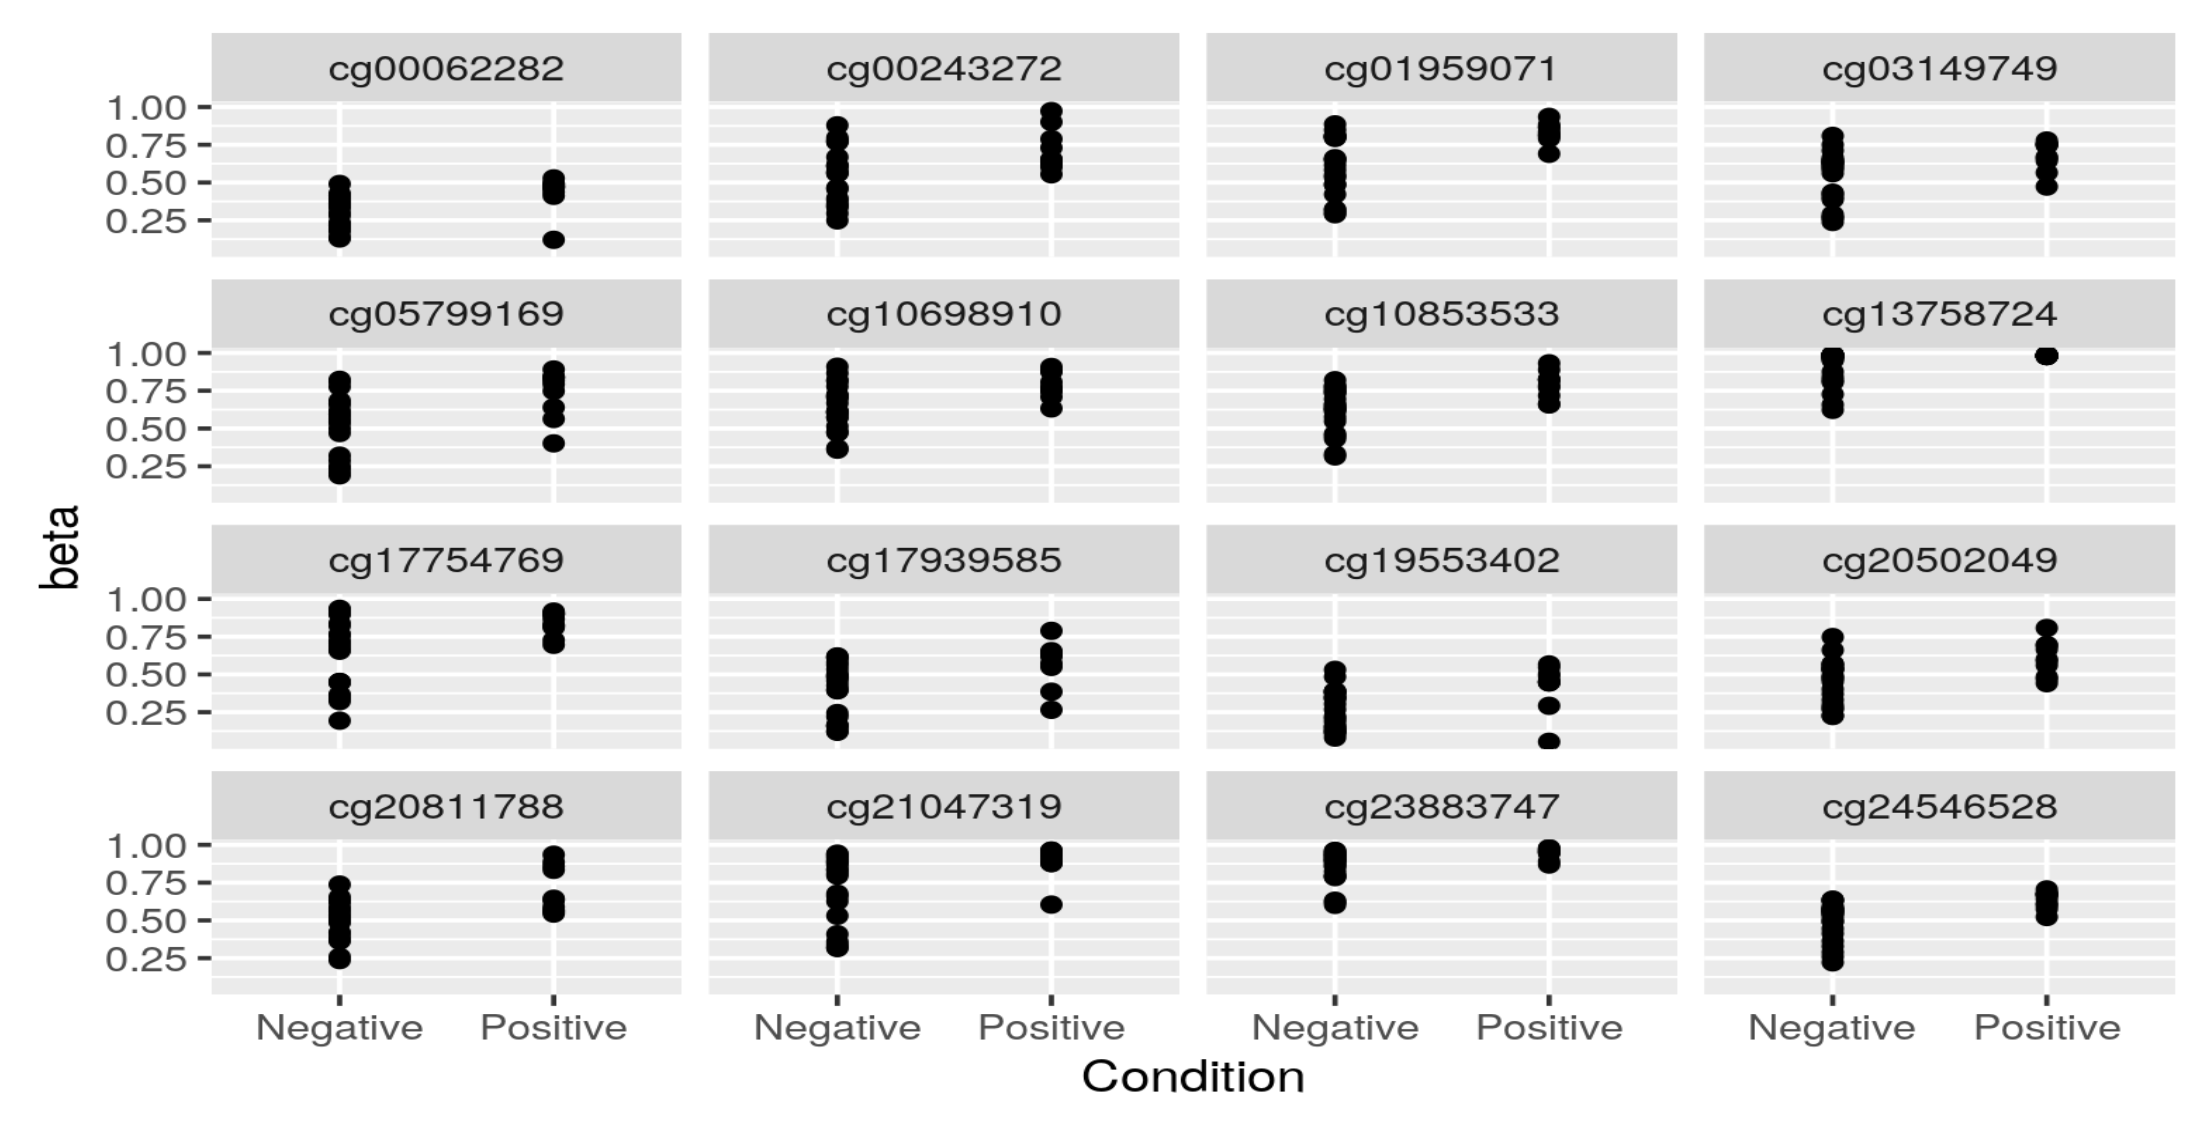
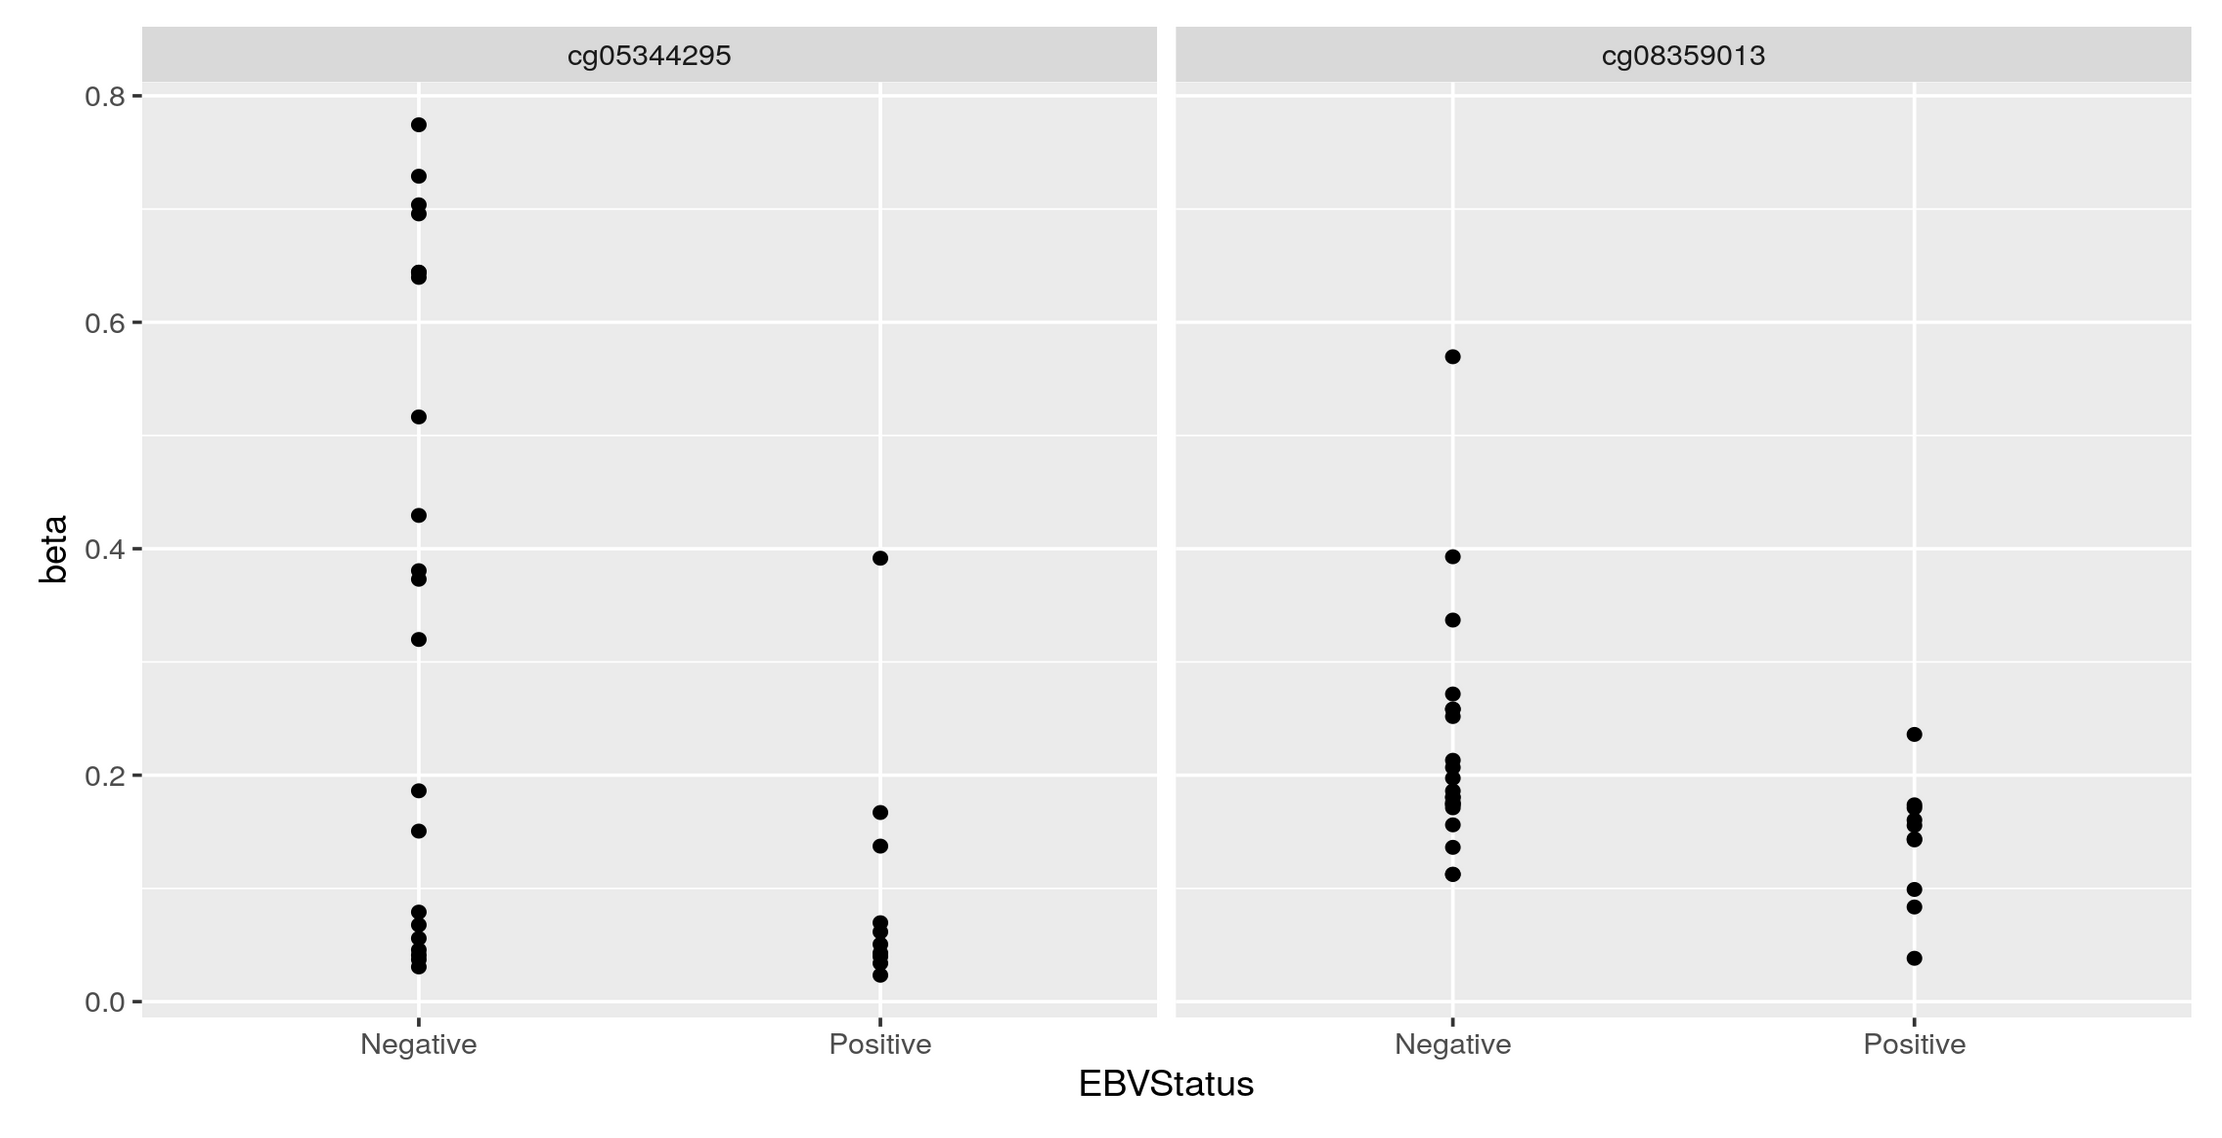

Could you post the code to generate the first volcano? It seems you expect the results of testEnrichment to be like a volcano, why do you expect so? As far as I know, over representative analysis don't have the same distribution as the moderated t-test for DEG or DEM.
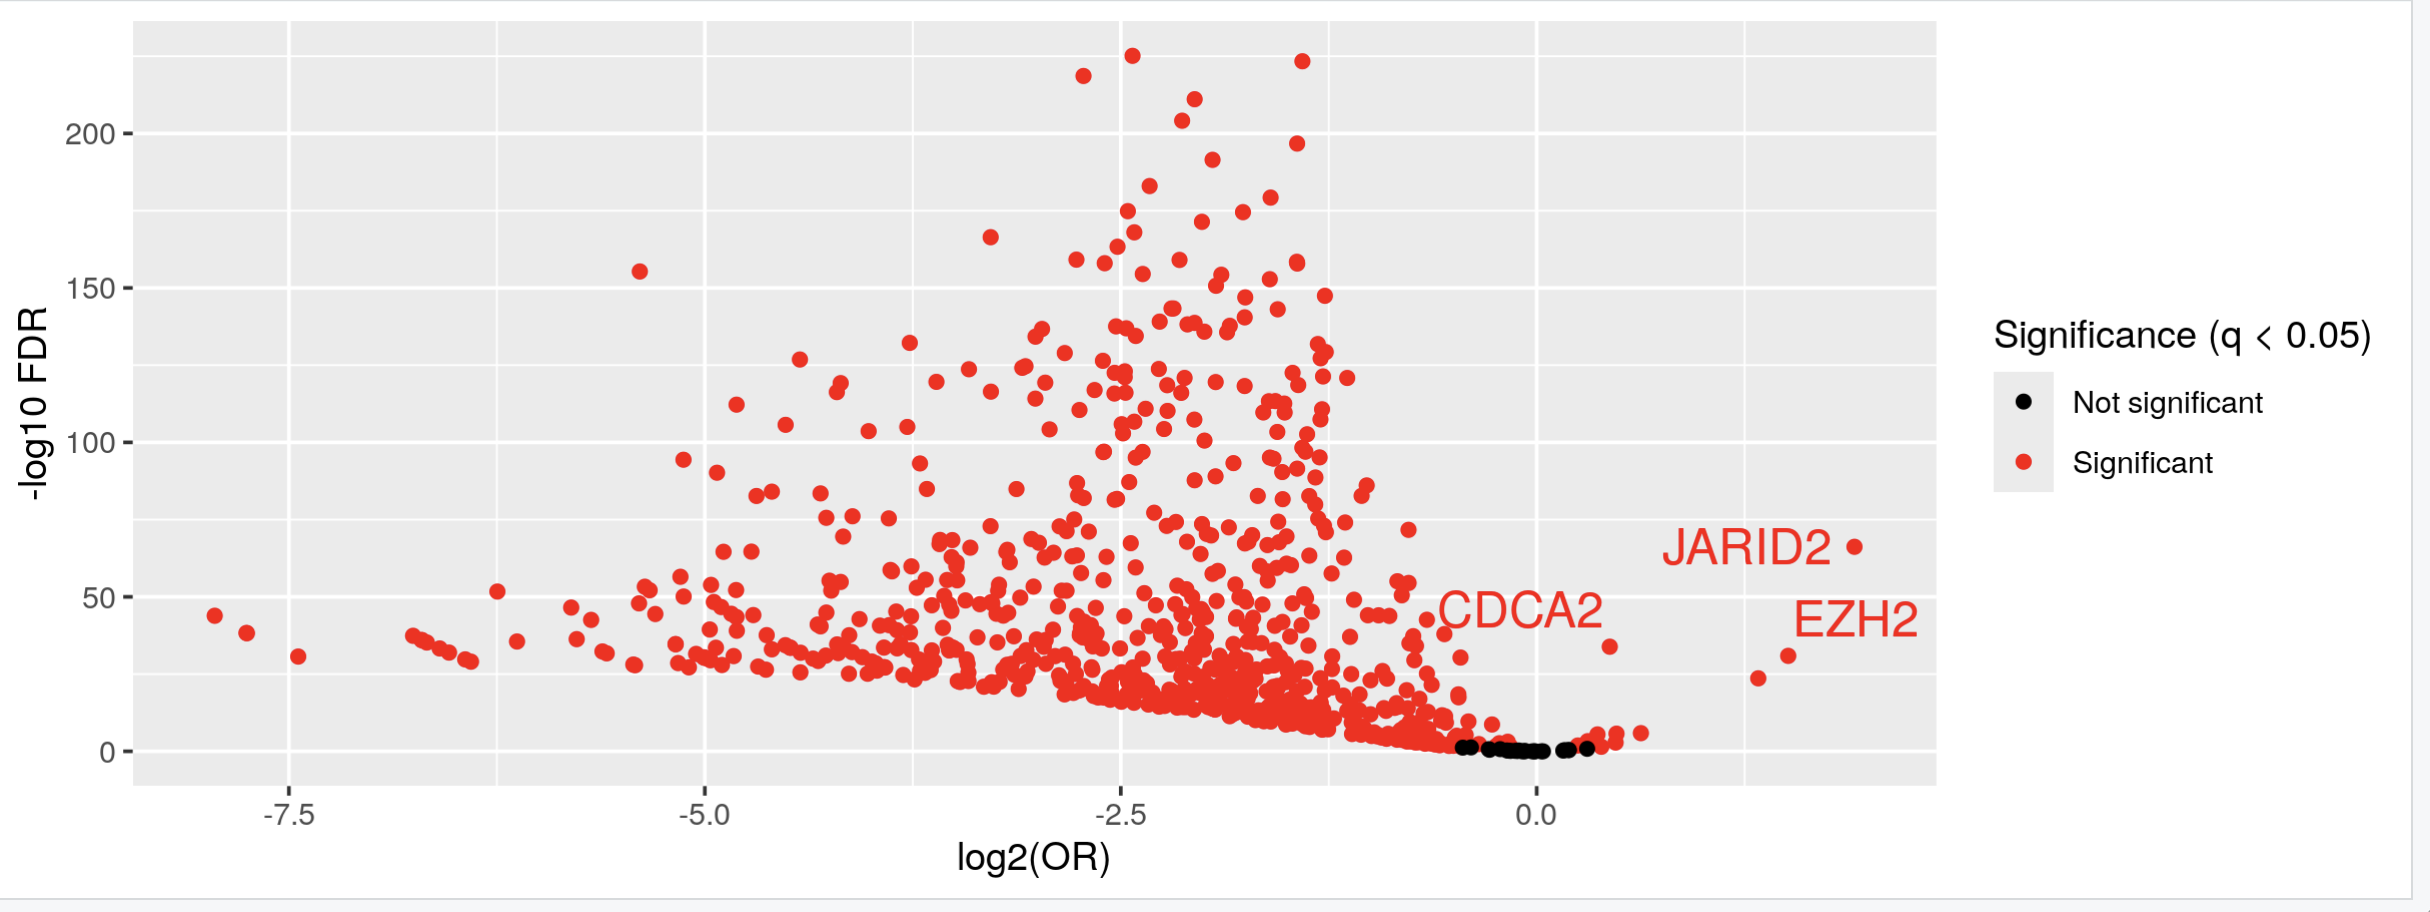
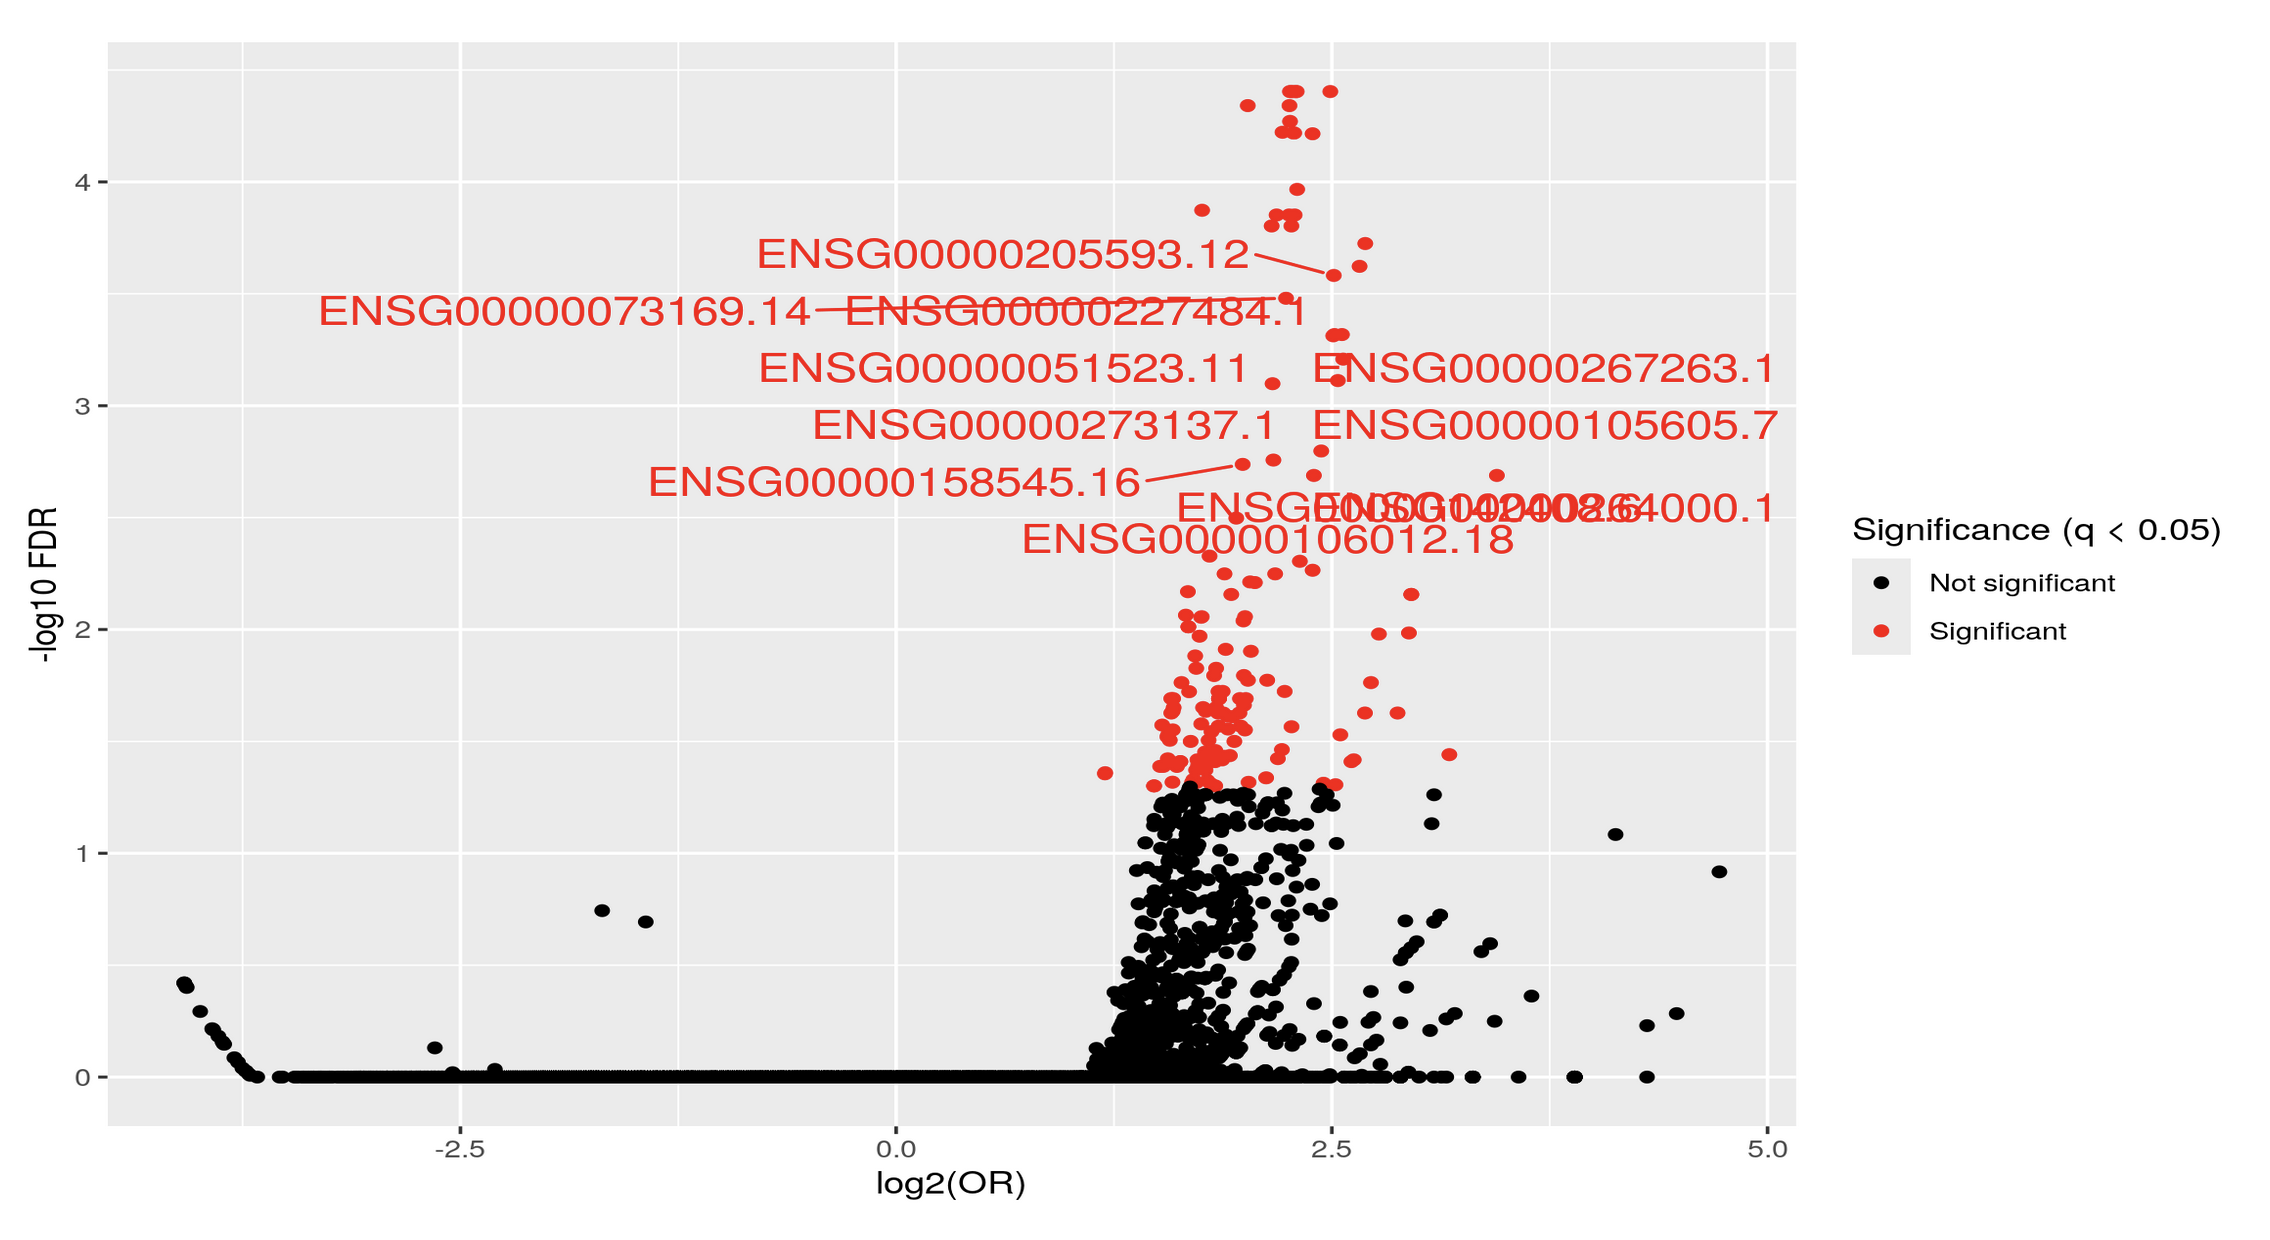
Thank you Luís, I just did put it's just: KYCG_plotVolcano(results,label_by="gene_name",alpha=0.01) (if I understand what you wanted), but in any case, I do expect the results to be like a volcano: i.e. I expect some genes to be significant in terms of being methylated both when the conditon is positive as well as when it is negative, hence a volcano. It is of course conceivable that the majority of genes will be significant only when the condition is positive, but if I do the analysis separately:
I do get significant genes in both way. I am not sure if I am interpreting the odds ratio correctly perhaps? Thank you so much and let me know if you have any other ideas.