Mostly increased counts in differentially accessible peaks using DESeq2
1
0
Entering edit mode
@e3765820
Last seen 1 day ago
United States

Hello,

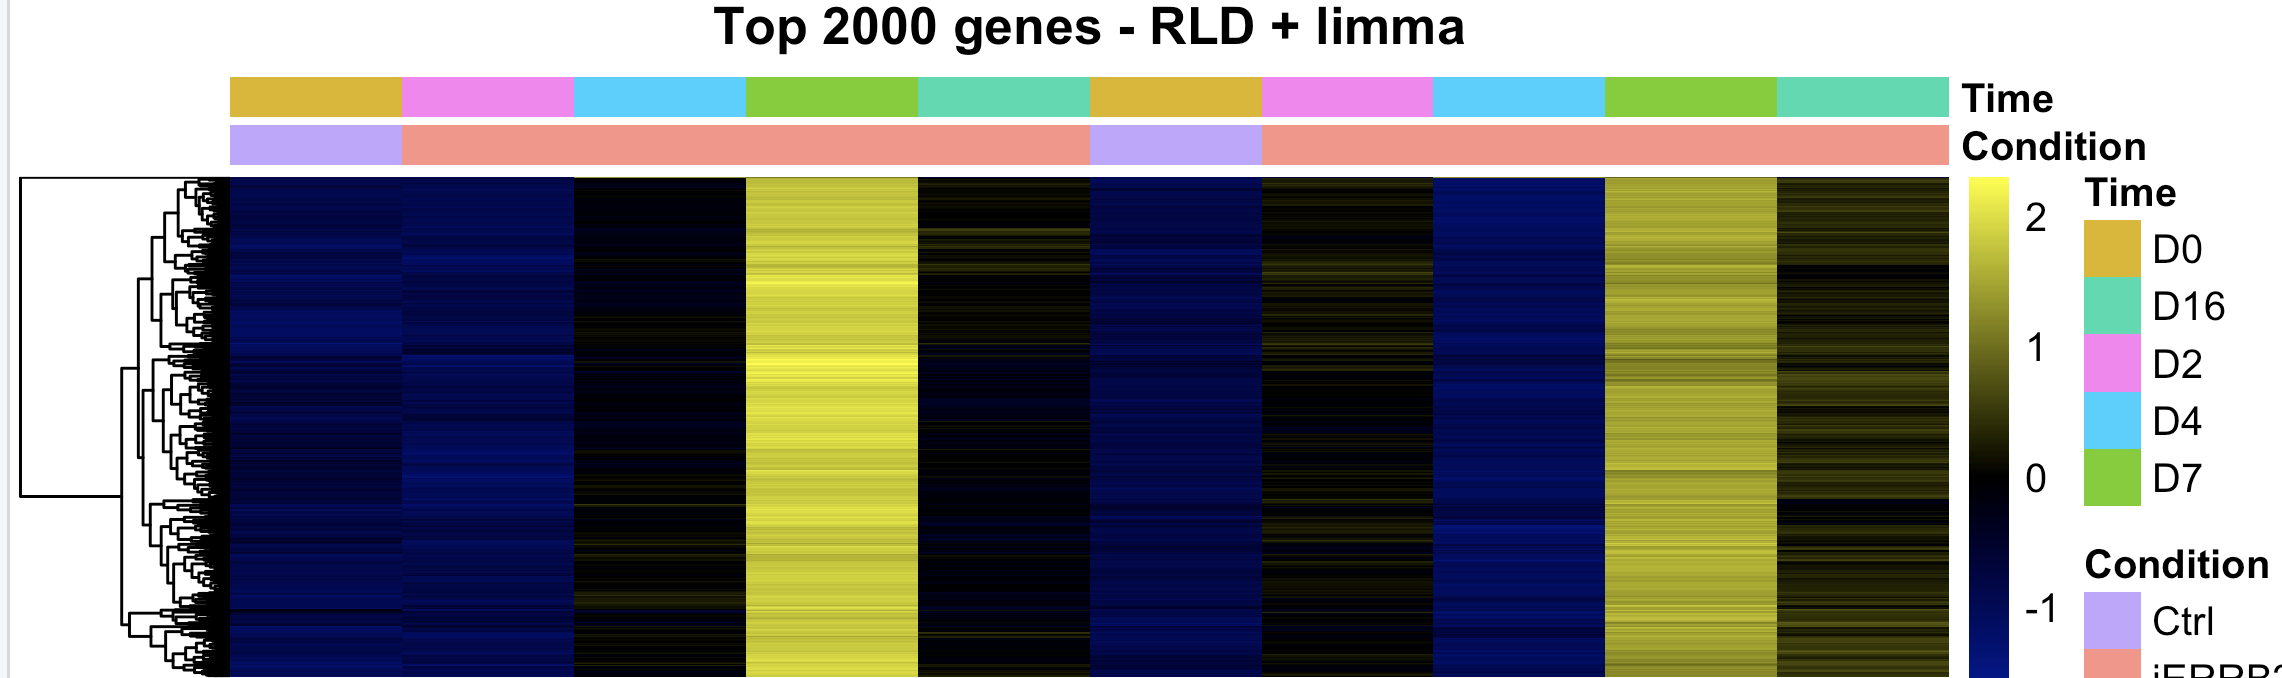
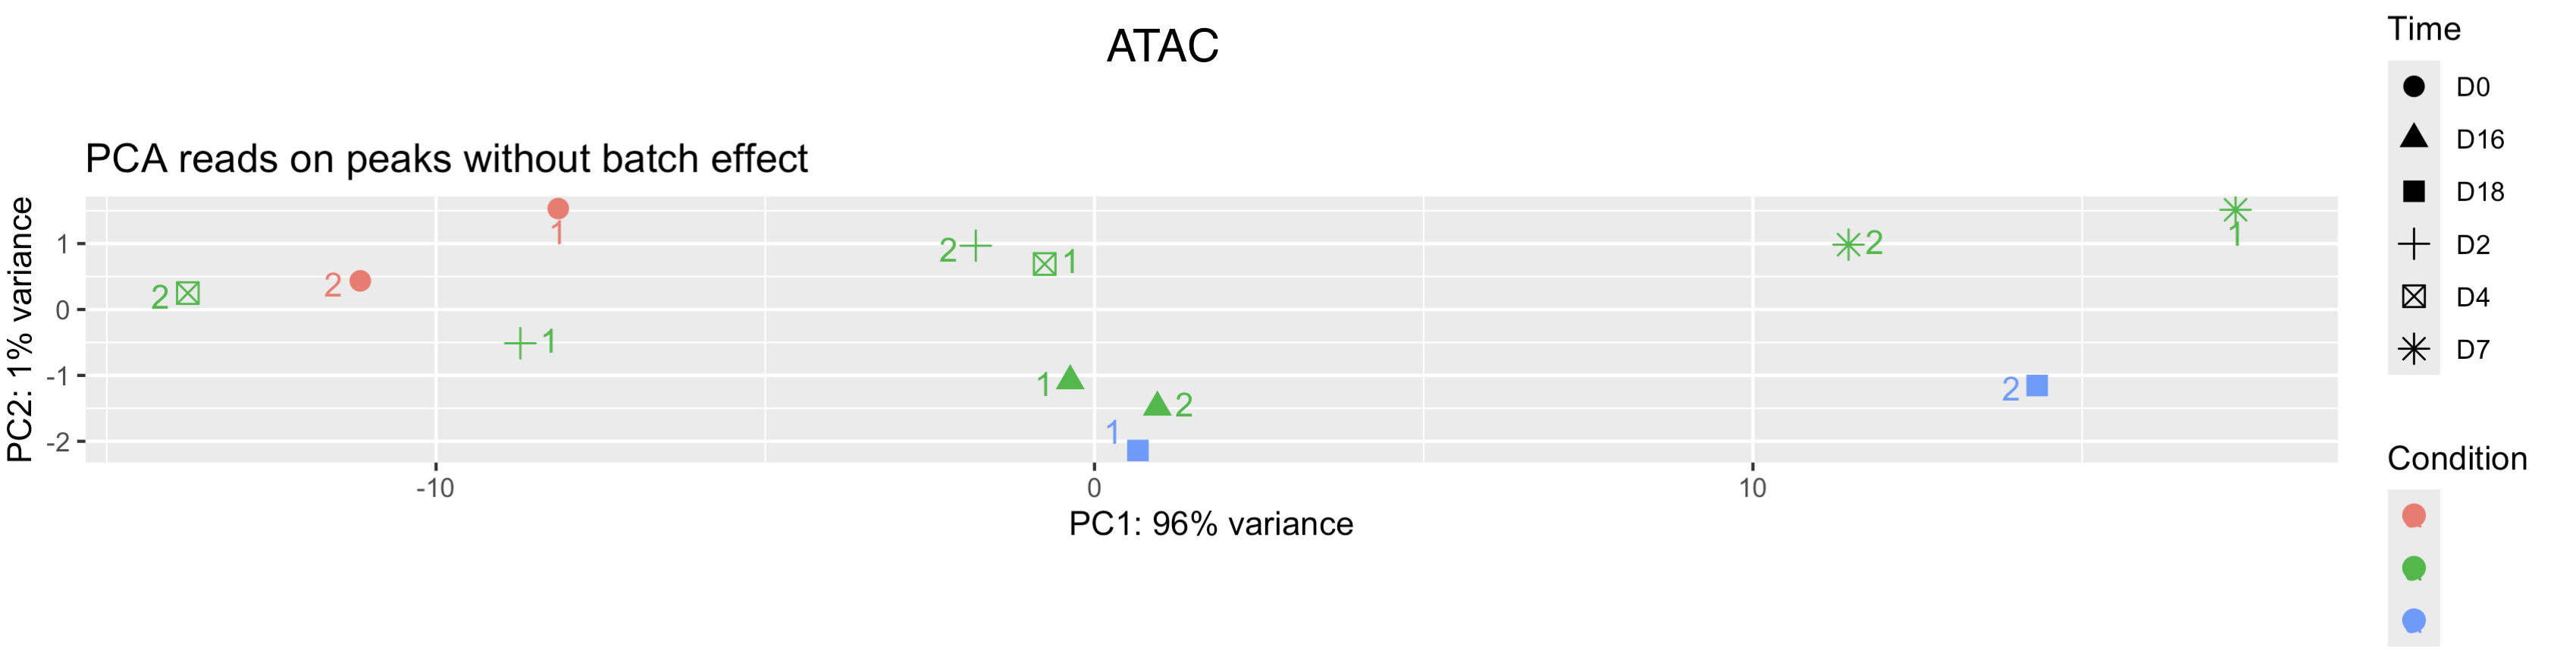
Looking for peace of mind really. We routinely perform bulk ATAC across multiple primary human cell types (fibros, immune cells). We recently did bulk ATAC-seq on human mammary epithelial cells and performed differential analysis with DESeq2. The design is 2 biological replicates of a 5 time-point time series. The counting step was done with summarizeOverlaps against an IDR-cleaned list of MACS3-detected peaks. We then contrasted each time point relative to the reference at Day 0. I have never seen this before, but DESeq2 only found mostly peaks with increased counts at one time point (Day 7), with close to 0 peaks with reduced counts. I have never seen such an unbalanced distribution (see MA plot and heatmap attached) MA heatmap. What is more interesting, is that when comparing against normalized signal tracks (by Deeptools), I can see several peaks with decreased counts relative to the Day 0 reference that DESeq2 did not catch (days going from top to bottom) browser. My padj cut-off is 0.05, which I think is still pretty relaxed. Has anyone seen something like this before? Not sure if I need to tweak something in the DESeq2 parameters or I should use something like featureCounts for the counting step.

Cheers for any insight,


# include your problematic code here with any corresponding output 
# please also include the results of running the following in an R session 

sessionInfo( )
ATAC-seq DESeq2 Oddresults • 140 views
ADD COMMENT
0
Entering edit mode

It is hard to comment here. My suggestion is:

  • label the IGV track, it's unclear which lane is which sample
  • normalize the track with the DESeq2 size factors (or has this been done already)
  • show the unshrunken MA-plot directly from results()
  • show a PCA
  • show actual DESeq2 code
ADD REPLY
0
Entering edit mode
@mikelove
Last seen 4 hours ago
United States

The difference between tracks and DESeq2 (or any count method in Bioc) is that tracks use simple scaling that is not robust to large shifts, whereas the count tools compute the median ratio (or some other trimming/robust technique). This is not a perfect remedy, but the fact that you have a bimodal pattern in the LFC is worth extra care. Just dividing by millions of mapped reads won't work on this dataset for quantitative comparisons. I would do a plotMA but label the promoters of housekeeping genes, or some other a priori information you have about what may be stable here.

ADD COMMENT

Login before adding your answer.

Traffic: 674 users visited in the last hour
Help About
FAQ
Access RSS
API
Stats

Use of this site constitutes acceptance of our User Agreement and Privacy Policy.

Powered by the version 2.3.6