RNA-Seq p value range variation
1
0
Entering edit mode
@3ae1e2e7
Last seen 42 minutes ago
United States

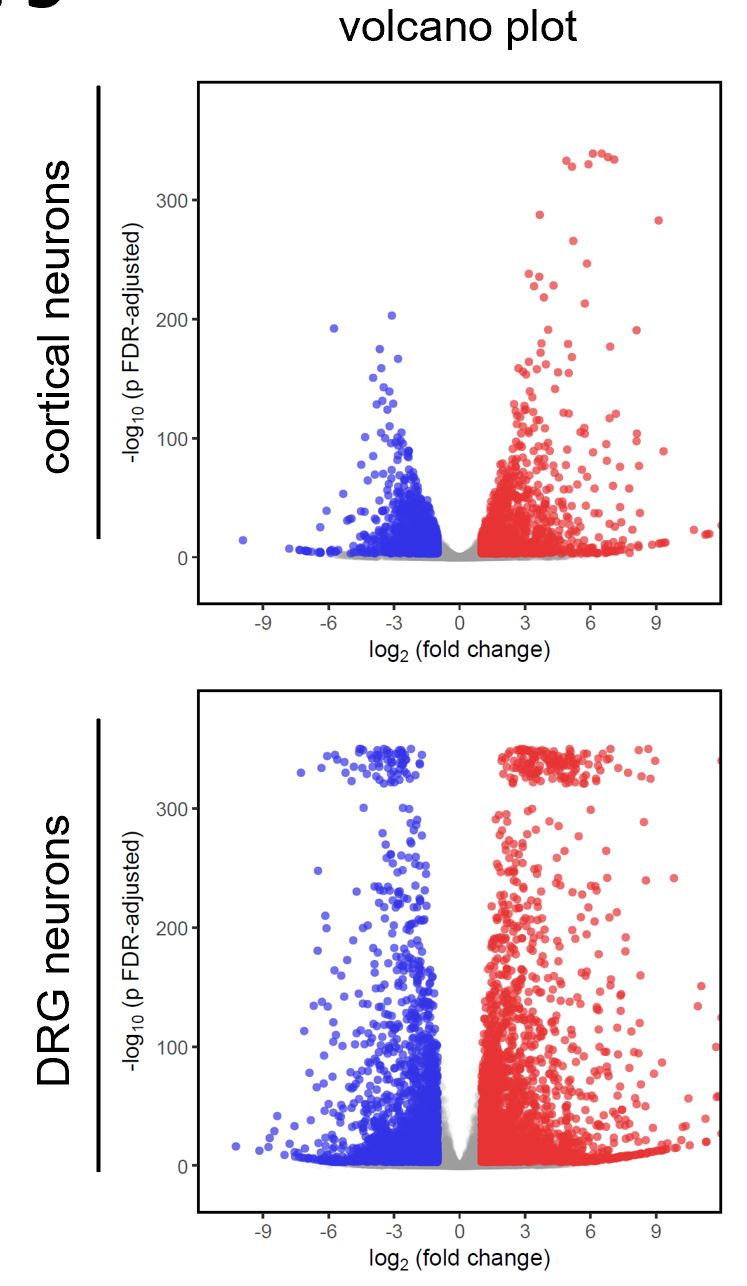
I performed two RNA-Seq experiments in exactly the same way, with the only difference being the studied cell type (mouse cortical neurons vs sensory DRG neurons). Everything about these experiments suggests they went really well, and the enriched genesets make a lot of sense.

About the attached volcano plots: Do I need to be concerned about the fact that the p value range is smaller in one experiment ? If the reason is in the underlying biology (and not a technical issue), is the explanation that a higher variability of individual measurements is sometimes observed ?

enter image description here

DESeq2 pvalue RNA-Seq • 54 views
ADD COMMENT
0
Entering edit mode
@mikelove
Last seen 2 hours ago
United States

The adjusted p-values are really just for thresholding at some value and giving you a bounded set.

Whether it's 1e-10 or 1e-100, it's just telling you how, under the null model, it would be unlikely to see such strong separation of two groups with such low within group variance. But I don't typically compare smallest p-values from one experiment vs another, I don't know what that would tell you.

ADD COMMENT
0
Entering edit mode

Thanks - all I wanted to hear (and I believe that is what you are saying) is that it is not concerning if p value ranges between two very similar experiments differ in the way shown. I am not trying to figure out the reason because I wouldn't know what to learn from it.

ADD REPLY

Login before adding your answer.

Traffic: 257 users visited in the last hour
Help About
FAQ
Access RSS
API
Stats

Use of this site constitutes acceptance of our User Agreement and Privacy Policy.

Powered by the version 2.3.6