
Hello,
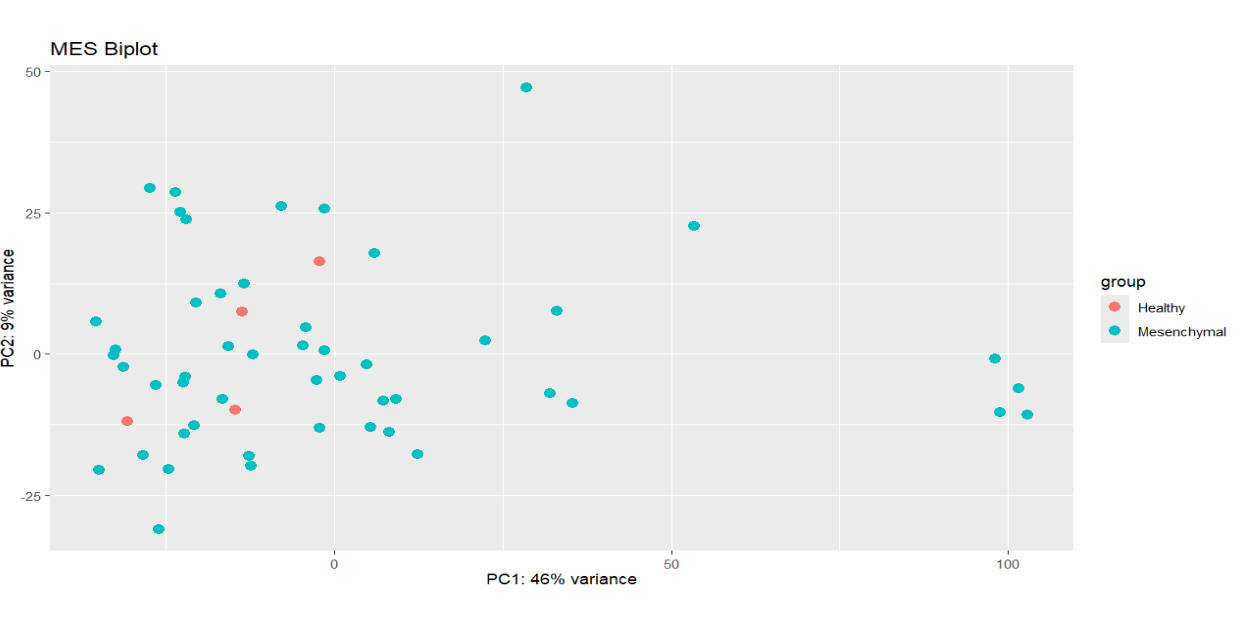
I am attempting to find the DEGs between Mesenchymal glioblastoma and healthy tissue samples using raw counts. However, PCA indicates no distinct clustering of healthy vs. tumor samples. In general, I am wondering how RNA-seq analysis of multiple in-vivo samples is conducted given their inherent heterogeneity. The code is not included here, but batch correction with sva also resulted in negligible changes.
All samples are from unique individuals, so there are no pairs of healthy vs. tumor samples from the same patient. The location of healthy sample collection is not known.
In general, can I extract any useful information from this RNA-seq dataset? How is RNA-seq analysis of large datasets with unlisted batch conditions handled? Any help is appreciated. Thank you!
library(tidyverse)
library(conflicted)
library(org.Hs.eg.db)
library(DESeq2)
library(ggplot2)
library(tools)
library(biomaRt)
library(GOSemSim)
library(RColorBrewer)
library(TCGAbiolinks)
library(sva)

query.GBM <- GDCquery(project = "TCGA-GBM",
                      data.category = "Transcriptome Profiling",
                      experimental.strategy = "RNA-Seq",
                      workflow.type = "STAR - Counts")

GDCdownload(query = query.GBM)
data <- GDCprepare(query = query.GBM, save = TRUE, save.filename = "GDC_TCGA_GBM.rda")

# Match sample barcodes to GlioVis clinical data format
colnames(counts) <- substring(colnames(counts), 1, 12)
colnames(counts) <- gsub("-", "." ,colnames(counts))

# Remove patients with multiple samples
duplicates <- colnames(counts)[duplicated(colnames(counts))]
counts <- counts[, !colnames(counts) %in% duplicates]

# Set "Subtype" of non-tumor samples to "Healthy"
pheno$Subtype[pheno$Histology == "Non-tumor"] <- "Healthy"

# filter pheno to include healthy and MES samples
pheno.MES <- pheno[pheno$Subtype == "Mesenchymal" |
                     pheno$Subtype == "Healthy", ]

counts.MES <- counts[, colnames(counts) %in% pheno.MES$Sample]

# Create counts metadata
col.data.MES <- pheno.MES[pheno.MES$Sample %in% colnames(counts.MES), c("Sample", "Subtype")]
col.data.MES$Subtype <- factor(col.data.MES$Subtype,
                               levels = c("Healthy", "Mesenchymal"))

col.data.MES <- col.data.MES %>%
  group_by(Subtype) %>%
  mutate(Sample_ID = Sample,
         Sample = paste0(ifelse(Subtype == "Healthy", "Healthy_", "MES_"), row_number())) %>%
  ungroup()

colnames(counts.MES) <- col.data.MES$Sample

# Remove genes with a total of less than 20 counts combined
counts.MES <- counts.MES[rowSums(counts.MES) > 20, ]

# Create DESeq object
dds.MES <- DESeqDataSetFromMatrix(countData = counts.MES,
                                  colData = col.data.MES,
                                  design = ~Subtype)
dds.MES <- DESeq(dds.MES)

# Plot PCA and check dispersion
vs.dds.MES <- vst(dds.MES, blind=FALSE)

plotPCA(vs.dds.MES, intgroup = c("Subtype")) +ggtitle("MES Biplot")
plotDispEsts(dds.MES)


Thanks for pointing to that repo ATpoint
The key insight with RUV is that, even with large count outliers, adding the RUV factors prevents FP and the model is really misspecified otherwise. The RUV factors soak up the variance from aberrant samples.
The only limitation is when batch and condition are totally confounded, then factor analysis can't help you.