pathview - multiple states
0
0
Entering edit mode
Philippine • 0
@e28160be
Last seen 4 weeks ago
Canada

Hi folks,

I am trying to do a KEGG pathways using pathview in R.

Example of data

        data<- data.frame( 
EntrezID = c(107965807, 406114, 410747, 409341, 727522, 113218875, 410228, 113219265, 100576126, 102656882),
d3 = c(-1.8505053, -1.6865244, -1.5905482, -1.5222310, -1.4876187, -1.4257670, -1.3510711, -1.3431686, -1.3236289, -1.3113374),
d1 = c(NA, -1.0918122, -1.1389847, -0.9339650, NA, -1.1790280, -1.1046071, -1.2304113, NA, -0.9977286)
    )

Example with one state (using gene list)

d3 - extracting logFC and names for d3

geneList1=data$d3 # logFC (negative and positive)
names(geneList1)=data$EntrezID # entrezid for each gene 

Run Pathview

pathview(gene.data  = geneList1,
         pathway.id = "ame04145",
         species    = "ame",
         na.col = "transparent",
         low = list(gene = "blue", cpd = "blue"), 
         mid =list(gene = "pink", cpd = "pink"), 
         high = list(gene = "red", cpd ="red"),
         limit = list(gene = 3), 
         bins = list(gene = 10), 
         both.dirs = list(gene = T),
         out.suffix="_d1"
         )

Very nice plot with gene modulated colored as asked

Comparing two states (d1 and d3)

rownames(data)=data$EntrezID 
pathview(gene.data = data[,2:3], 
                           limit = list(gene = 3), 
                           bins = list(gene = 10), 
                           both.dirs = list(gene = T),
                           pathway.id = "ame04145",
                           species = "ame", 
                           keys.align = "y", 
                           kegg.native = T, 
                           match.data = T,
                            same.layer = T,
                           multi.state = T, out.suffix="mixed")

Output

Warning: None of the genes or compounds mapped to the pathway!
Argument gene.idtype or cpd.idtype may be wrong.
Warning: No annotation package for the species ame, gene symbols not mapped!
Info: Working in directory /Users/camilledeboissel/Library/CloudStorage/OneDrive-Personal/Post-doc/Amro-Zayed_BeeCSI/Phiphi_analysis/All_samples_analysis
Info: Writing image file ame04145.mixed.png
Warning message:
In colnames(plot.data)[c(1, 3, 9:ncs)] <- c("kegg.names", "all.mapped",  :
  number of items to replace is not a multiple of replacement length

What am I doing wrong here? Why is it working with a geneList input and not as multistate ?

Thank you for your help

pathview Pathways KEGG • 361 views
ADD COMMENT
0
Entering edit mode

A quick comment after I copied/pasted your code: when using geneList1 in the 3rd code chunk I do not get a nice plot... I rather got the same error that none of the ids mapped to the pathway! Yet, it does work when mapping to pathway.id = "ame00500"! Note that in your code chunk you used as input geneList (thus without the suffix 1!)

Thus: your example input can indeed not be mapped on pathway ame04145.

ADD REPLY
0
Entering edit mode

Thank you! Here a subset of genes that really works with "ame04145".

data <- data.frame(
  EntrezID = c(100577548, 100577764, 406097, 408388, 408782, 409055, 409074, 409165, 409946, 410510,
               410614, 410994, 410996, 411295, 411519, 411816, 411892, 412810, 412886, 413394, 413409,
               550827, 551093, 551176, 551369, 551467, 551721, 551961, 552410, 552419, 552476, 552720,
               552756, 724873, 725404, 725770, 727630),
  d3 = c(-0.3160703, 0.1744582, 0.2486408, 0.3705891, 0.4113416, -0.138168, -0.1286653, 0.2179565, -0.25528,
         0.1109674, -0.447057, -0.2836039, -0.4338239, -0.1359435, 0.4601004, 0.1777216, -0.1788376, -0.3106547,
         0.3039518, 0.121097, 0.1156489, 0.2935189, -0.1476104, -0.3896508, -0.4518688, -0.1381761, -0.1364185,
         -0.2484124, -0.1674127, 0.1881968, -0.1057918, -0.2627917, -0.2030586, 0.100829, -0.2246011, 0.1204396,
         -0.2196931),
  d1 = c(NA, 0.1612697, NA, NA, 0.2773722, -0.1260812, -0.1465551, NA, -0.2141968, NA, NA, NA, NA, -0.1331895,
         NA, NA, NA, -0.3220328, NA, NA, 0.1060707, NA, -0.1569927, -0.3378576, -0.3689568, NA, NA, NA, -0.1658039,
         0.1535351, NA, -0.2494884, -0.1717161, NA, NA, 0.1328381, -0.1424635)
)

I run

geneList=data$d1
names(geneList)=data$EntrezID
pathview(gene.data  = geneList,
         pathway.id = "ame04145",
         species    = "ame",
         na.col = "transparent",
         low = list(gene = "blue", cpd = "blue"), 
         mid =list(gene = "pink", cpd = "pink"), 
         high = list(gene = "red", cpd ="red"),
         limit = list(gene = 3), 
         bins = list(gene = 10), 
         both.dirs = list(gene = T),
         out.suffix="_d1"
         )

Info: Downloading xml files for ame04145, 1/1 pathways..
Info: Downloading png files for ame04145, 1/1 pathways..
Warning: No annotation package for the species ame, gene symbols not mapped!

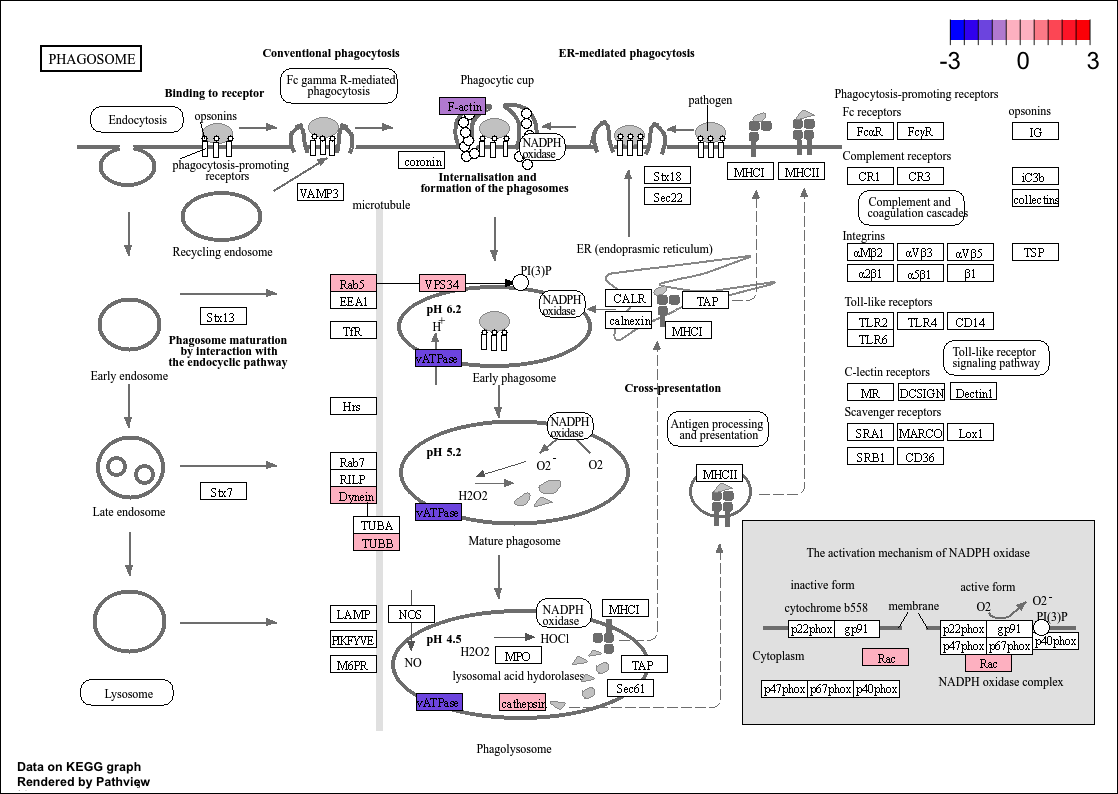
And this i my actual output enter image description here

When I run

rownames(data)=data$EntrezID
pathview(gene.data  = data[,2:3],
         pathway.id = "ame04145",
         species    = "ame",
         na.col = "transparent",
         low = list(gene = "blue", cpd = "blue"), 
         mid =list(gene = "pink", cpd = "pink"), 
         high = list(gene = "red", cpd ="red"),
         limit = list(gene = 3), 
         bins = list(gene = 10), 
         both.dirs = list(gene = T),
         out.suffix="_d1"
         )

Warning: None of the genes or compounds mapped to the pathway!
Argument gene.idtype or cpd.idtype may be wrong.
Warning: No annotation package for the species ame, gene symbols not mapped!

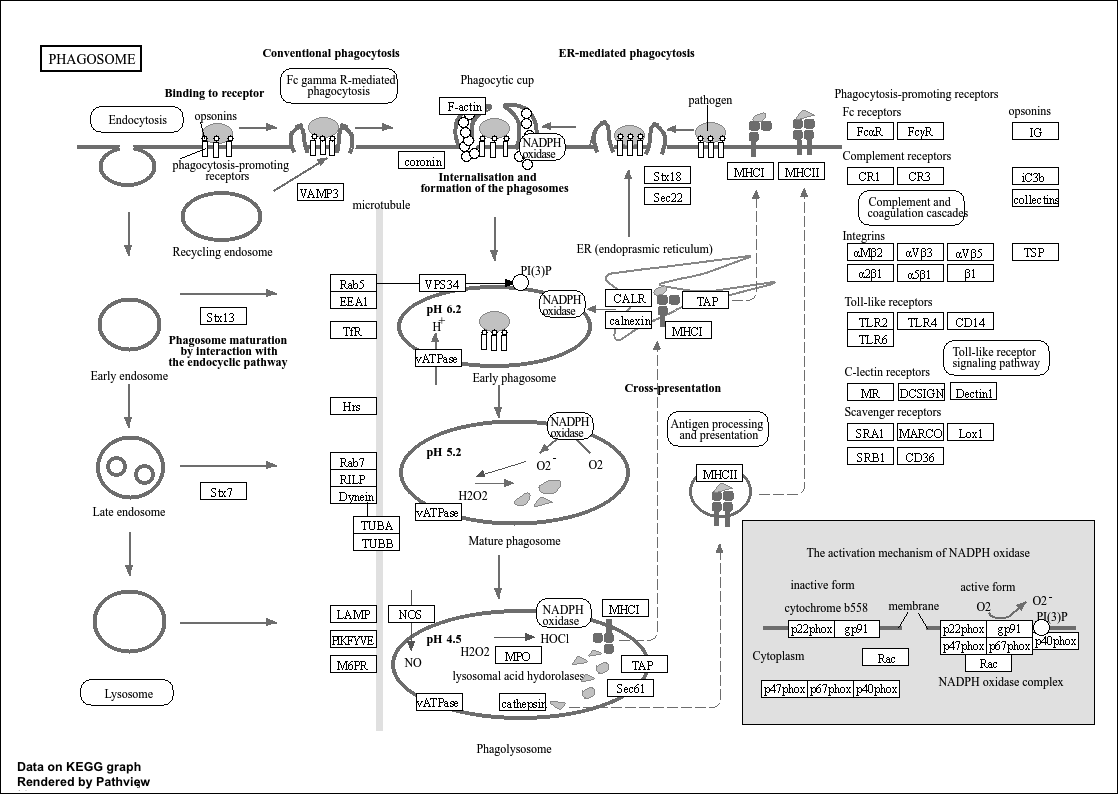
And I got this pawthay... enter image description here

So i am not sure what I am missing here. Thanks for your feedback

ADD REPLY
1
Entering edit mode

According to the the help page of pathview (type ?pathview) the input should be either vector (single sample) or a matrix-like data (multiple sample). Note that your input is a data.frame. Converting this to a matrix makes your code work, taking into account the NA.

> library(pathview)
> 
> data <- data.frame(
+   EntrezID = c(100577548, 100577764, 406097, 408388, 408782, 409055, 409074, 409165, 409946, 410510,
+                410614, 410994, 410996, 411295, 411519, 411816, 411892, 412810, 412886, 413394, 413409,
+                550827, 551093, 551176, 551369, 551467, 551721, 551961, 552410, 552419, 552476, 552720,
+                552756, 724873, 725404, 725770, 727630),
+   d3 = c(-0.3160703, 0.1744582, 0.2486408, 0.3705891, 0.4113416, -0.138168, -0.1286653, 0.2179565, -0.25528,
+          0.1109674, -0.447057, -0.2836039, -0.4338239, -0.1359435, 0.4601004, 0.1777216, -0.1788376, -0.3106547,
+          0.3039518, 0.121097, 0.1156489, 0.2935189, -0.1476104, -0.3896508, -0.4518688, -0.1381761, -0.1364185,
+          -0.2484124, -0.1674127, 0.1881968, -0.1057918, -0.2627917, -0.2030586, 0.100829, -0.2246011, 0.1204396,
+          -0.2196931),
+   d1 = c(NA, 0.1612697, NA, NA, 0.2773722, -0.1260812, -0.1465551, NA, -0.2141968, NA, NA, NA, NA, -0.1331895,
+          NA, NA, NA, -0.3220328, NA, NA, 0.1060707, NA, -0.1569927, -0.3378576, -0.3689568, NA, NA, NA, -0.1658039,
+          0.1535351, NA, -0.2494884, -0.1717161, NA, NA, 0.1328381, -0.1424635)
+ )
> 
> class(data)
[1] "data.frame"
> head(data)
   EntrezID         d3         d1
1 100577548 -0.3160703         NA
2 100577764  0.1744582  0.1612697
3    406097  0.2486408         NA
4    408388  0.3705891         NA
5    408782  0.4113416  0.2773722
6    409055 -0.1381680 -0.1260812
> 
> ## convert to matrix, but do not include 1st column
> matrix.data <- as.matrix(data[,-1])
> 
> ## use 1st column as rownames for matrix
> rownames(matrix.data) <- data[,1]
> 
> class(matrix.data)
[1] "matrix" "array" 
> head(matrix.data)
                  d3         d1
100577548 -0.3160703         NA
100577764  0.1744582  0.1612697
406097     0.2486408         NA
408388     0.3705891         NA
408782     0.4113416  0.2773722
409055    -0.1381680 -0.1260812
> 
> ## run pathview
> ## note that the 2 columns are explicitly defined, but since the
> ## data sets consists only of 2 samples this would not be needed now.
> pathview(gene.data  = matrix.data[,1:2],
+          pathway.id = "ame04145",
+          species    = "ame",
+          na.col = "transparent",
+          low = list(gene = "blue", cpd = "blue"), 
+          mid =list(gene = "pink", cpd = "pink"), 
+          high = list(gene = "red", cpd ="red"),
+          limit = list(gene = 3), 
+          bins = list(gene = 10), 
+          both.dirs = list(gene = T),
+          out.suffix="_d1"
+          )
Warning: No annotation package for the species ame, gene symbols not mapped!
Info: Working in directory xx:/yy
Info: Writing image file ame04145._d1.multi.png
> 
> 

enter image description here

ADD REPLY
0
Entering edit mode

:D Thank you!!! It works perfectly.

ADD REPLY

Login before adding your answer.

Traffic: 809 users visited in the last hour
Help About
FAQ
Access RSS
API
Stats

Use of this site constitutes acceptance of our User Agreement and Privacy Policy.

Powered by the version 2.3.6